
HIGHLIGHTS
- Made good progress in delivering strategic goals; improved many aspects of operating performance.
- Delivered a concentrated portfolio ahead of schedule.
- Kept expansion of the Port Arthur site on track for completion in 2012. Once complete, the site will have doubled in size to become North America’s largest refinery with planned capacity of some 600 thousand b/d.
- Moved into biofuels production with the start-up of our Raízen joint venture in Brazil. The joint venture produces and commercialises ethanol and power from sugar cane and distributes a variety of transportation and industrial fuels through a combined distribution and retail network in Brazil. With annual production capacity of more than two billion litres, Raízen is one of the world’s largest ethanol producers.
- Was named the number-one global lubricant supplier by the consultancy Kline & Company for the fifth consecutive year.
- Secured our 1,000th retail site in China. Overall, 271 new sites were secured in 2011 and the total number of secured sites reached 1,011 by the end of the year.
- Developed promising new leads to expand Chemicals: Signed the heads of agreement with Qatar Petroleum for proposals to develop a world-scale petrochemical complex in Qatar; announced an investment decision to build a 500-tonne per year demonstration unit to manufacture diphenyl carbonate; and announced our intent to explore the opportunity to build a cracker in the North East of the USA.
| Download XLS |
|
KEY STATISTICS | |||||||||||
|---|---|---|---|---|---|---|---|---|---|---|---|
|
|
2011 |
2010 |
2009 |
2008 |
2007 | ||||||
| |||||||||||
|
Downstream CCS earnings ($ million) |
|
|
|
|
| ||||||
|
Oil products |
2,235 |
1,439 |
(58) |
5,153 |
6,906 | ||||||
|
Chemicals |
2,054 |
1,511 |
316 |
156 |
1,682 | ||||||
|
Total Downstream earnings ($ million) [A] |
4,289 |
2,950 |
258 |
5,309 |
8,588 | ||||||
|
Total Downstream earnings excluding identified items |
4,274 |
3,873 |
1,940 |
5,744 |
8,289 | ||||||
|
Downstream cash flow from operations ($ million) [B] |
8,746 |
8,138 |
5,839 |
1,750 |
13,150 | ||||||
|
Total oil products sales (thousand b/d) |
6,196 |
6,460 |
6,156 |
6,568 |
6,625 | ||||||
|
Chemicals sales volumes (thousand tonnes) |
18,831 |
20,653 |
18,311 |
20,327 |
22,555 | ||||||
|
Refinery intake (thousand b/d) |
2,845 |
3,197 |
3,067 |
3,388 |
3,779 | ||||||
|
Oil products refinery availability (%) |
92 |
92 |
93 |
91 |
91 | ||||||
|
Petrochemicals manufacturing plant |
89 |
94 |
92 |
94 |
93 | ||||||
|
Downstream net capital investment ($ million) |
4,342 |
2,358 |
6,232 |
3,104 |
2,682 | ||||||
|
Downstream capital employed ($ million) |
71,976 |
67,287 |
62,632 |
54,050 |
65,042 | ||||||
|
Downstream employees (thousands) |
51 |
59 |
62 |
64 |
69 | ||||||
|
CCS EARNINGS [A] $ billion
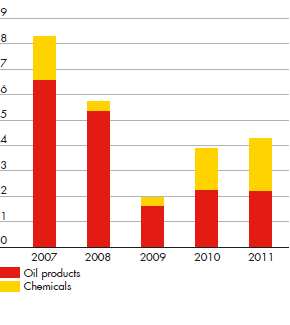
[A] Excluding identified items. |
AVAILABILITY AND SALES VOLUMES volume
% availability 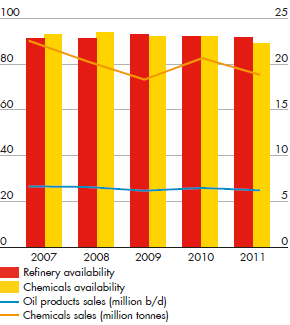
|
