Upstream overview
In 2015, Shell Upstream
- Achieved first production from the Corrib gas field in Ireland. At peak production, the Corrib gas field is expected to produce around 45 thousand barrels of oil equivalent per day (boe/d).
- In Nigeria, we announced first production from two deep-water projects, the Bonga Phase 3 project (Shell interest 55%) and Erha North Phase 2 (Shell interest 43.75%). The Bonga Phase 3 project is an expansion of the Bonga Main development, with peak production expected to be about 50 thousand boe/d.
- We took a major final investment decision (FID) to advance the Appomattox deep-water development (Shell interest 79%) in the Gulf of Mexico, USA. Appomattox will initially produce from the Appomattox and Vicksburg fields, with peak production estimated to be around 175 thousand boe/d.
- In Nigeria, we completed the sale of our 30% interest in OMLs 18 and 29 and related facilities in the Eastern Niger Delta, and the Nembe Creek Trunk Line for a total consideration of around $2.4 billion. In addition, we completed the sale of our 30% interests in OMLs 71 and 72. Both of these blocks were non-producing.
So far in 2016
- In January 2016, in the United Arab Emirates, we decided to exit the joint development of the Bab sour gas reservoirs (Shell interest 40%) with Abu Dhabi National Oil Company (ADNOC).
- In February 2016, we announced that we postponed the FID on the Bonga South West deep-water project in Nigeria.
- In Brazil, we started production of oil from the third phase of the deep-water Parque das Conchas BC-10 development (Shell interest 50%) in the Campos basin.
- Also in Brazil, the seventh non-operated floating, production, storage and offloading vessel (FPSO), Cidade de Marciá, (Shell interest 25%) reached first oil in the BM-S-11 block of the Santos Basin, offshore Brazil. The FPSO has a production capacity of 150 thousand barrels per day.
Upstream key statistics |
|||||||||
|---|---|---|---|---|---|---|---|---|---|
|
2015 |
2014 |
2013 |
2012 |
2011 |
||||
|
|||||||||
Earnings ($ million) |
(8,833) |
5,231 |
3,640 |
11,254 |
17,186 |
||||
Earnings excluding identified items ($ million) |
(2,255) |
6,754 |
6,644 |
10,693 |
14,192 |
||||
Cash flow from operations ($ million) |
5,453 |
19,150 |
17,841 |
22,131 |
22,913 |
||||
Liquids production (thousand b/d) [A] |
1,305 |
1,263 |
1,317 |
1,495 |
1,556 |
||||
Natural gas production (million scf/d) [A] |
5,911 |
6,593 |
7,059 |
7,488 |
7,588 |
||||
Total production (thousand boe/d) [A][B] |
2,323 |
2,399 |
2,534 |
2,786 |
2,864 |
||||
Capital investment ($ million) |
18,349 |
22,169 |
28,481 |
25,102 |
18,580 |
||||
Capital employed ($ million) |
84,727 |
88,692 |
93,135 |
87,413 |
79,303 |
||||
Employees (thousands) |
22 |
22 |
21 |
N/A |
N/A |
||||
Upstream earnings [A]
$ billion
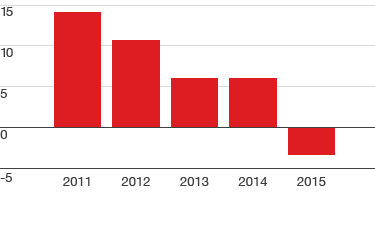

[A] Excluding identified items.
Production
million boe/d
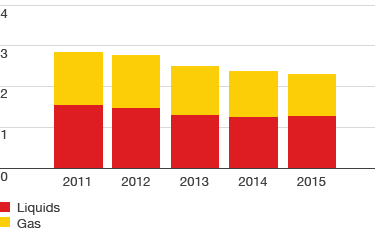

boe(/d)
barrels of oil equivalent (per day); natural gas volumes are converted to oil equivalent using a factor of 5,800 scf per barrel
View complete glossary
boe(/d)
barrels of oil equivalent (per day); natural gas volumes are converted to oil equivalent using a factor of 5,800 scf per barrel
View complete glossary