Results
Summary of results |
$ million unless specified |
||||||
|---|---|---|---|---|---|---|---|
|
2016 |
2015 |
2014 |
2013 |
2012 |
||
|
|||||||
Income attributable to Royal Dutch Shell plc shareholders |
4,575 |
1,939 |
14,874 |
16,371 |
26,712 |
||
CCS adjustment for Downstream [A] |
1,042 |
(1,903) |
(4,167) |
(374) |
(452) |
||
CCS earnings attributable to shareholders |
3,533 |
3,842 |
19,041 |
16,745 |
27,164 |
||
Identified items [A] |
(3,652) |
(7,604) |
(4,010) |
(3,273) |
1,905 |
||
CCS earnings attributable to shareholders excluding identified items |
7,185 |
11,446 |
23,051 |
20,018 |
25,259 |
||
Non-controlling interest |
(270) |
(316) |
(55) |
(164) |
(222) |
||
CCS earnings excluding identified items |
7,455 |
11,762 |
23,106 |
20,182 |
25,481 |
||
Integrated Gas |
3,700 |
5,057 |
10,332 |
8,999 |
9,414 |
||
Upstream |
(2,704) |
(2,255) |
6,754 |
6,644 |
10,693 |
||
Downstream (CCS basis) |
7,243 |
9,748 |
6,265 |
4,466 |
5,343 |
||
Corporate |
(784) |
(788) |
(245) |
73 |
31 |
||
Basic CCS earnings per share ($) |
0.45 |
0.61 |
3.02 |
2.66 |
4.34 |
||
CCS adjustment per share ($) |
0.13 |
(0.30) |
(0.66) |
(0.06) |
(0.07) |
||
Basic earnings per share ($) |
0.58 |
0.31 |
2.36 |
2.60 |
4.27 |
||
Basic earnings per ADS ($) |
1.16 |
0.62 |
4.72 |
5.20 |
8.54 |
||
Cash flow from operating activities |
20,615 |
29,810 |
45,044 |
40,440 |
46,140 |
||
Dividend per share ($) |
1.88 |
1.88 |
1.88 |
1.80 |
1.72 |
||
Dividend per ADS ($) |
3.76 |
3.76 |
3.76 |
3.60 |
3.44 |
||
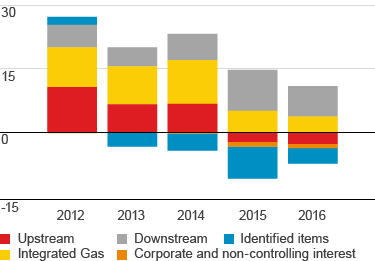
CCS earnings
$ billion

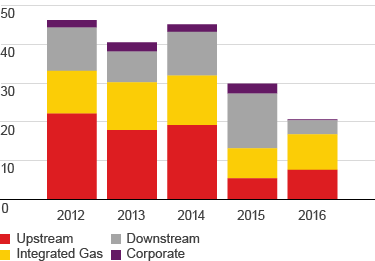
Cash flow from operating activities
$ billion

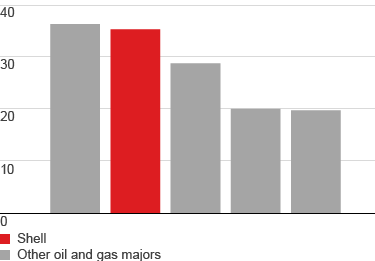
ROACE 2016 [A]
%

[A] European companies: CCS earnings excluding identified items. US companies: reported earnings excluding special non-operating items. Capital employed on gross debt basis.
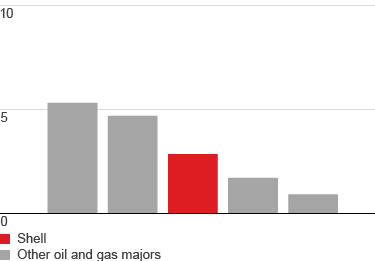
Total shareholder return 2016
%