Downstream overview


Oil products
Cash engine


Chemicals
Growth priority
Milestones in 2016
- Downstream achieved the second-highest earnings since 2008. Notably, our results featured a strong performance from our Marketing business, benefiting from growth in premium branded products which helped generate higher unit margins. The Retail business had its strongest year ever.
- We announced the final investment decision (FID) to expand our 50:50 joint venture with CNOOC in Huizhou, Guangdong Province, China, which includes the Nanhai petrochemicals complex. The expansion includes the ongoing construction of a new ethylene cracker and ethylene derivatives units, which are expected to increase ethylene capacity by more than 1 million tonnes per year when fully completed in 2019.
- We announced the FID to build a major petrochemicals complex, comprising an ethylene cracker with polyethylene derivatives unit in Pennsylvania, USA. Main construction is expected to start by 2018, with commercial production beginning early in the next decade.
- Shell completed the sale of a number of our interests including:
- our Denmark Marketing business to Couche-Tard.
- a 31.2% interest in Showa Shell in Japan to Idemitsu, retaining a 3.8% interest.
- our 51% interest in Shell Refining Company (SRC) to Malaysia Hengyuan International Limited (SRC owns the Port Dickson refinery).
- In the Philippines, Pilipinas Shell Petroleum Corporation (PSPC), a subsidiary of Shell, priced its initial public offering (IPO) at 67 Philippine pesos per share. Following the IPO, Shell remains the majority shareholder in PSPC with a 55% interest.
- We signed agreements for sales that are expected to complete in 2017 subject to regulatory approval. These include:
- our 20% interest in Vivo Energy, the Shell licensee in 16 markets in Africa, to Vitol Africa B.V., for $250 million.
- our Australian aviation business to Viva Energy Australia Pty Ltd., for a total transaction value of approximately $250 million.
- the Fredericia refinery and local trading and supply activities in Denmark to Dansk Olieselskab ApS, for approximately $80 million including working capital.
Additionally, in 2017
- Shell and SABIC signed an agreement whereby SABIC will acquire Shell’s 50% share in the petrochemicals SADAF joint venture, located in Jubail, Kingdom of Saudi Arabia for $820 million. The transaction is subject to regulatory approval and is expected to complete later this year.
- Also, Saudi Refining Inc. (SRI) and Shell announced the signing of binding definitive agreements on the separation of assets, liabilities and businesses of Motiva Enterprises LLC. Subject to regulatory approval, the transaction is expected to close in the second quarter of 2017. A balancing payment of $2.2 billion has been agreed between the parties, subject to adjustments including for working capital.
Downstream – key statistics |
|||||
|---|---|---|---|---|---|
|
2016 |
2015 |
2014 |
2013 |
2012 |
CCS earnings ($ million), of which: |
6,588 |
10,243 |
3,411 |
3,869 |
5,382 |
Oil Products |
4,940 |
8,654 |
1,994 |
2,026 |
4,008 |
Chemicals |
1,648 |
1,589 |
1,417 |
1,843 |
1,374 |
CCS earnings excluding identified items ($ million) |
7,243 |
9,748 |
6,265 |
4,466 |
5,343 |
Cash flow from operating activities ($ million) |
3,556 |
14,076 |
11,292 |
7,903 |
11,111 |
Oil Products sales volumes (thousand b/d) |
6,483 |
6,432 |
6,365 |
6,164 |
6,235 |
Chemicals sales volumes (thousand tonnes) |
17,292 |
17,148 |
17,008 |
17,386 |
18,669 |
Refinery processing intake (thousand b/d) |
2,701 |
2,805 |
2,903 |
2,915 |
2,819 |
Refinery availability (%) |
90 |
90 |
93 |
94 |
92 |
Chemical plant availability (%) |
90 |
85 |
85 |
92 |
91 |
Capital investment ($ million) |
6,057 |
5,119 |
5,910 |
5,528 |
5,454 |
Capital employed ($ million) |
52,671 |
46,280 |
48,925 |
64,507 |
62,426 |
Employees (thousands) |
40 |
43 |
47 |
48 |
48 |
Downstream CCS earnings and ROACE [A]
$ billion
%
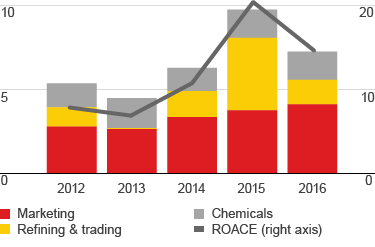

[A] CCS earnings excluding identified items, ROACE on a CCS basis excluding identified items.
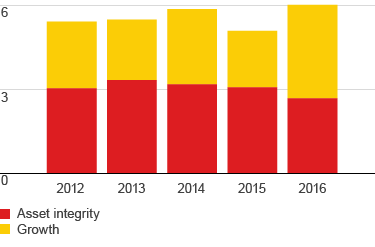
Downstream capital investment
$ billion