Integrated Gas overview


Integrated Gas
Cash engine


New energies
Future opportunity
Milestones in 2016
- In Indonesia, INPEX Masela Ltd (Shell interest 35%), received a notification from the Indonesian government authorities instructing it to re-propose a development plan for the Abadi gas field based on an onshore LNG project.
- In Australia, the participants in the Browse joint arrangement (Shell interest 27%) decided not to move forward with the selected development concept in the current economic and market environment. We still intend to develop the Browse field.
- Shell and its partners in the LNG Canada joint venture (Shell interest 50%) decided to postpone a final investment decision (FID) on the proposed export project in British Columbia.
- We decided to delay the FID on the Lake Charles LNG project in the USA that was planned for 2016. The proposed project would convert the existing Lake Charles LNG regasification facility owned by Energy Transfer into a liquefaction plant in which we would have capacity rights.
- We were appointed by the Energy Market Authority of Singapore as one of the importers for the next tranche of LNG supply into Singapore, which is expected to begin in 2017. Shell and another importer will have exclusivity for three years to supply up to 1 million tonnes of LNG per year each.
- In August 2016, we signed an agreement with the Gibraltar government for the supply of LNG and the construction of a regasification unit to provide gas for power generation in Gibraltar.
- The Sabine Pass LNG export terminal in the USA started operations in February and we have started loading volumes in line with a long-term offtake agreement assumed on the acquisition of BG.
- In Australia, production of LNG and condensate from the first train at the Gorgon LNG project (Shell interest 25%) on Barrow Island, off the northwest coast, started in March 2016. The second train started production in October 2016.
- In September 2016, the first loading of the Shell-chartered Coral Methane vessel was completed at the recently opened third jetty at the Gas Access to Europe (GATE) LNG terminal in Rotterdam, the Netherlands.
- As announced in December 2016, the Pearl GTL plant (Shell interest 100%) in Qatar operated at a reduced rate of production due to unforeseen maintenance required on the gasifier units, until a controlled shutdown on February 1, 2017. We expect Pearl to be ramping back up during the second quarter of 2017.
|
Integrated gas key statistics | |||||||||
|---|---|---|---|---|---|---|---|---|---|
|
|
2016 |
2015 |
2014 |
2013 |
2012 | ||||
|
|||||||||
|
Earnings ($ million) |
2,529 |
3,170 |
10,610 |
8,998 |
10,990 |
||||
|
Earnings excluding identified items ($ million) |
3,700 |
5,057 |
10,332 |
8,999 |
9,414 |
||||
|
Cash flow from operating activities ($ million) |
9,132 |
7,728 |
12,689 |
12,273 |
10,930 |
||||
|
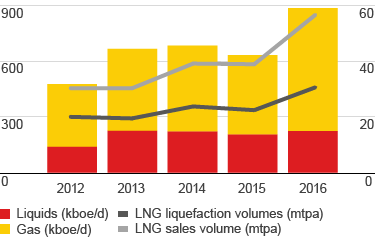
Liquids production (thousand b/d) [A] |
223 |
204 |
221 |
224 |
138 |
||||
|
Natural gas production (million scf/d) [A] |
3,832 |
2,469 |
2,666 |
2,557 |
1,961 |
||||
|
Total production (thousand boe/d) [A][B] |
884 |
631 |
682 |
665 |
476 |
||||
|
LNG liquefaction volumes (million tonnes) |
30.9 |
22.6 |
24.0 |
19.6 |
20.2 |
||||
|
LNG sales volumes (million tonnes) |
57.1 |
39.2 |
39.5 |
30.5 |
30.6 |
||||
|
Capital investment ($ million) |
26,214 |
5,178 |
9,124 |
11,822 |
6,077 |
||||
|
Capital employed ($ million) |
86,631 |
62,481 |
62,127 |
60,657 |
47,561 |
||||
|
Employees (thousands) |
13 |
13 |
11 |
10 |
N/A |
||||
Integrated Gas earnings and cash flow [A]
$ billion
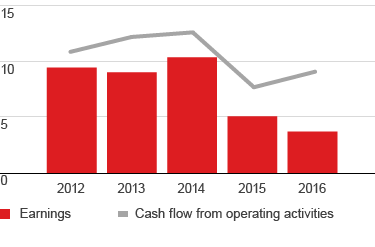

[A] Earnings excluding identified items.
Production available for sale
kboe/d