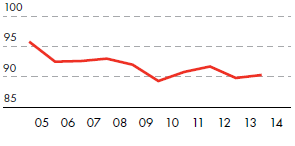
Energy intensity – Upstream
(excluding Oil Sands and GTL)
gigajoules/tonne production [A]
[A] 2012-2014 data is reported in accordance with
IPIECA/API/IOGP guidance 2010.
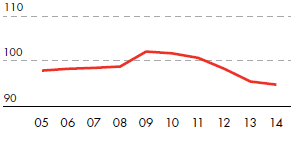
Energy intensity – Oil Sands
gigajoules/tonne production [A]
[A] Includes mining and upgrading operations.
One of the ways we can manage our direct GHG emissions is to work on improving the energy efficiency of the facilities we operate. The main metric that we use to measure our energy efficiency is energy intensity (the amount of energy consumed for every unit of output).
In 2014, the overall energy intensity for the production of oil and gas in our Upstream business (excluding oil sands and gas-to-liquids (GTL)) slightly improved compared with 2013, partially driven by increased production in Brazil, Iraq and Nigeria.
All our major facilities have energy management plans in place to make the best use of those facilities, including the use of improved field management techniques. We expect that maintaining the energy efficiency levels of recent years will be more difficult in the future as existing fields age and new production comes from more energy-intensive sources. This may increase our upstream energy intensity over time.
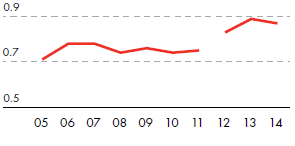
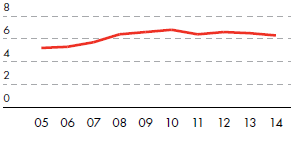
In our oil sands operations, energy intensity in 2014 improved compared with 2013. In 2014, the overall energy intensity for the manufacturing of oil products at our refineries improved compared with 2013. The overall energy intensity of our chemical plants in 2014 was higher than in 2013, due to increased unplanned downtime.
Energy intensity – Refineries
refinery energy index [A]
[A] Indexed to 2002; based on 2006 Solomon EIITM methodology.
Energy intensity – Chemical plants
chemicals energy index