Environmental performance
We improved or maintained our environmental performance across many business areas during 2016. This was due to operational improvements as well as reduced activity and divestments. Details about our environmental performance are provided below and under the greenhouse gas emissions, managing methane emissions and flaring sections.
Managing water use
The availability of fresh water is a growing challenge in some regions of the world. We manage our water use responsibly, and because water constraints tend to affect people at the local or regional level, we tailor our use of fresh water to local conditions.
In water-scarce areas, we develop water management plans. These plans describe the long-term risks to water availability and define measures to minimise our use of fresh water or recommend alternatives to fresh water, such as recycled water, processed sewage water and desalinated water. Waste water from our operations is treated before it is released into the environment. Where appropriate, we look for ways to treat waste water using natural solutions such as constructed wetlands. This also helps us to reduce the energy use associated with water management.
In Doha, Qatar, for example, our research and technology centre is working on a pilot programme to test whether constructed wetlands can remove chemicals from water generated as a by-product of oil and gas production. At our joint venture operations in the Omani desert, we use reed beds to naturally clean the water that is extracted alongside oil production.
“We map where fresh water is scarce”
Internal opinion
“Our global centre of excellence for water at the Shell Technology Centre in Bangalore allows us to share ideas, innovations and technologies across Shell to improve our water efficiency. For example, we develop technologies that enable the reuse and recycling of fresh water to manage our water footprint in a responsible way while meeting environmental standards. Shell participates in a join industry project with partners including the Dutch government and universities to find new ways of using saline water to minimise freshwater intake.
We also map where fresh water is scarce to understand the tension between freshwater demand and supply. This helps us improve our knowledge of the subsurface to manage our use of fresh water in our facilities.
Having a better understanding of the ways water and hydrocarbons separate helps us design projects more efficiently and improve our environmental footprint.
Shell continues to explore ways to reduce the potential cost of water risks to our facilities. With advanced chemistry and engineering, we can improve our current performance in line with best practice and prepare for future legislation.”
Albert Janssen
Manager Water Technology, Shell, Bangalore, India
We are also involved in a number of working groups with different organisations, such as the World Business Council for Sustainable Development and IPIECA.
In 2016, our intake of freshwater increased to 195 million cubic metres of fresh water, compared to 186 million cubic metres in 2015, mainly due to higher water demand in our oil sands mining operations. Around 65% of our fresh water consumption was for manufacturing oil products and chemicals and a further 22% was used by oil sands mining operations.
Fresh water withdrawn
million cubic metres
Enlarge image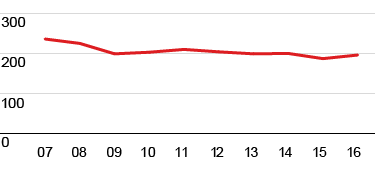

Fresh water consumed
million cubic metres
Enlarge image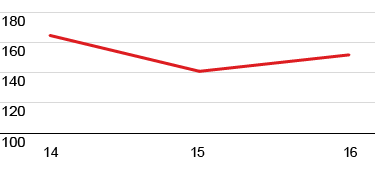

Spills
Shell has clear requirements and procedures in place to prevent operational spills. We have routine programmes to maintain our facilities and pipelines, and improve their reliability, in order to reduce operational spills. However, spills still occur for reasons such as operational failure, accidents or unusual corrosion.
There were 71 operational oil spills in 2016, down from 108 in 2015. The volume of operational spills of oil and oil products in 2016 was 0.7 thousand tonnes, 11% less than in 2015.
The number of spills caused by sabotage and theft fell to 46 from 94 in 2015. The volume of these spills decreased to 1.4 thousand tonnes in 2016 from 2.2 thousand tonnes in 2015. In 2016, sabotage and oil theft remained a significant cause of spills in the Niger Delta, Nigeria.
We investigate and learn from all spills to improve our performance and we clean up the areas near our operations that are affected by spills, irrespective of the cause. As of the end of March 2017, there were five spills under investigation in Nigeria that may result in adjustments to our figures.
Spills – Operational [A]
Enlarge image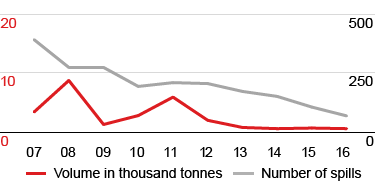

[A] Over 100 kilograms.
Spills – Sabotage [A]
Enlarge image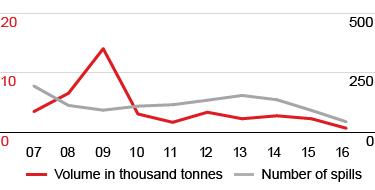

[A] Sabotage and theft-related spills over 100 kilograms.
Energy efficiency
One of the ways we manage our greenhouse gas (GHG) emissions is to work on improving the energy efficiency of the facilities we operate. The main metric that we use to measure our energy efficiency is energy intensity – that is, the amount of energy consumed for every unit of output.
Shell produces GHG and energy management plans with annual updates for Shell-operated facilities that account for more than 50,000 tonnes of GHG emissions per year, and for each proposed project that will account for more than 500,000 tonnes of GHG emissions per year.
These plans must include the sources of GHG emissions, as well as a forecast of expected emissions at the site for at least 10 years, and it must outline options for improving energy efficiency or reducing emissions.
Some of the ways Shell improved energy efficiency include making our equipment more reliable through maintenance, by smart scheduling of maintenance activities or by installing more energy-efficient equipment.
The overall energy intensity index of our chemical plants and refineries in 2016 was similar to the year before. For our chemicals plants, it improved slightly to 91.0 in 2016, compared to 91.6 in 2015. For our refineries, it was unchanged at 95.4.
Energy intensity – Chemical plants
chemicals energy index [A]
Enlarge image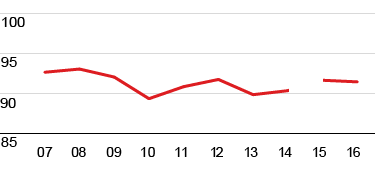

[A] CEI calculation methodology changed in 2015; therefore, data for prior years are not directly comparable.
Energy intensity – Refineries
refinery energy index [A]
Enlarge image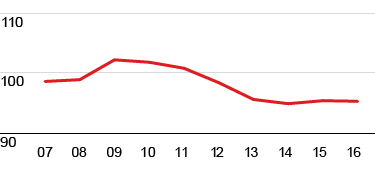

[A] Indexed to 2002; based on 2006 Solomon EIITM methodology.
In 2016, chemical plants and refineries continued to focus on operational improvements, including how to reduce unplanned shut downs, which require significant amounts of extra energy to start up again. Together, these measures had a cumulative effect on the amount of energy we use to produce energy and chemical products, and ultimately our energy intensity. For example, the combined heat and power plant at our Bukom refinery and chemical plant in Singapore had its first full year of operation in 2016. It is expected to reduce total energy consumption at Bukom by between 4% and 5%, saving more than 200,000 tonnes of CO2 a year. Other sites have strengthened the integration and monitoring of energy efficiency in their daily operational routine, ensuring that energy use is optimised.
In our oil sands operations, energy intensity improved to 5.5 gigajoules in 2016, from 5.8 gigajoules for every tonne of production in 2015, due to improvements in operational efficiency. This was our best result in nearly a decade. Combined with Quest carbon capture storage, we reduced the GHG emissions intensity from oil sands activities by more than 15%.
In 2016, the overall energy intensity for the production of oil and gas in our Upstream and Integrated Gas businesses (excluding liquefied natural gas and gas-to-liquids) worsened compared with 2015, mainly due to inclusion of former BG assets in our portfolio. We expect it will be difficult to maintain the energy-efficiency levels of recent years, as existing fields age and new production comes from more energy-intensive sources. This may increase our upstream energy intensity over time.
Our Downstream and Upstream operations are learning from each other to improve performance. For example, our energy-efficiency surveillance tool enhances real-time data availability enabling corrective actions to be become part of a daily routine. The tool was developed by Downstream, and was deployed at our offshore oil and gas field Bonga, Nigeria (Shell interest 55%), in 2015. In 2016, it was implemented at other sites in Nigeria, Norway and the UK, and plans are in place for Malaysia.
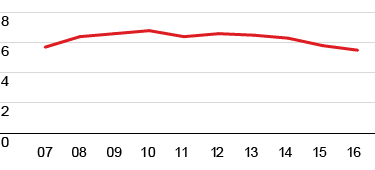
Energy intensity – Upstream
(excluding Oil Sands and GTL)
gigajoules/tonne production [A]
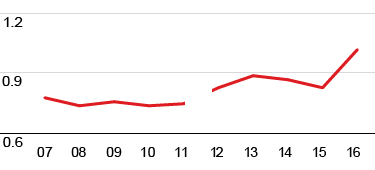

[A] 2012-2016 data are reported in accordance with IPIECA/API/OGP guidance 2010.
Energy intensity – Oil Sands
gigajoules/tonne production [A]

[A] Includes mining and upgrading operations.
“Sending heat from the refinery to the city”
External opinion
“In 2006, the Rotterdam district of Hoogvliet started exploring the idea of using waste heat from the nearby Shell refinery in Pernis for its district heating network. Eventually there was a plan that was technically feasible, but not economical because of the raise of the foreseen investments.
The breakthrough came when we visited the MiRO refinery, which supplies heat to the city of Karlsruhe, Germany. As supplier of waste heat heating company, there were two important insights for us. You should not recover waste heat from the primary production process of a refinery. And, as partners, you should start with the solutions that are relatively easy to realise, technically and for your organisation. Because of the security of supply of the current heat transport network from Pernis, Warmtebedrijf Rotterdam is looking for a second heat supplier. In 2016, we signed a contract with Shell and expect to start taking heat from the Pernis refinery at the end of 2018.”
Co Hamers
Director, Warmtebedrijf Rotterdam, Rotterdam, Netherlands
Air emissions
We track emissions released into the atmosphere from our upstream and downstream facilities and work to reduce air pollution from our operations. This includes making investments to lower our emissions of nitrogen oxides, sulphur oxides and volatile organic compounds that are released during oil and gas production and processing. These pollutants can affect air quality in the areas where we operate. We evaluate and take action to mitigate potential adverse impacts of our emissions.
Our sulphur oxides emissions in 2016 continued to fall compared to the previous year.
Our nitrogen oxides emissions increased from 104 thousand tonnes in 2015 to 122 thousand tonnes in 2016. The increase was primarily driven by the inclusion of former BG facilities in our portfolio.
Our emissions of volatile organic compounds (VOCs) increased to 146 thousand tonnes in 2016 compared with 125 thousand tonnes in 2015. This was mostly due to an increase of venting at our facilities in Majnoon, Iraq. We expect our VOC emissions to decrease in the coming years as a result of our efforts to reduce flaring and venting.