| Download XLS |
|
SUMMARY OF RESULTS |
$ MILLION | ||||
|---|---|---|---|---|---|
|
|
2014 |
2013 |
2012 |
2011 |
2010 |
|
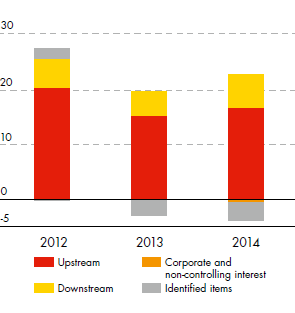
Upstream |
15,841 |
12,638 |
22,244 |
24,466 |
15,935 |
|
Downstream (CCS basis) |
3,411 |
3,869 |
5,382 |
4,170 |
2,950 |
|
Corporate and non-controlling interest |
(211) |
238 |
(462) |
(103) |
(242) |
|
CCS earnings |
19,041 |
16,745 |
27,164 |
28,533 |
18,643 |
|
CCS adjustment for Downstream |
(4,167) |
(374) |
(452) |
2,293 |
1,484 |
|
Income attributable to Royal Dutch Shell plc shareholders |
14,874 |
16,371 |
26,712 |
30,826 |
20,127 |
|
Identified items |
(3,521) |
(2,747) |
1,905 |
3,938 |
570 |
|
CCS earnings excluding identified items |
22,562 |
19,492 |
25,259 |
24,595 |
18,073 |
|
Basic CCS earnings per share ($) |
3.02 |
2.66 |
4.34 |
4.60 |
3.04 |
|
CCS adjustment per share ($) |
(0.66) |
(0.06) |
(0.07) |
0.37 |
0.24 |
|
Basic earnings per €0.07 ordinary share ($) |
2.36 |
2.60 |
4.27 |
4.97 |
3.28 |
|
Basic earnings per ADS ($) |
4.72 |
5.20 |
8.54 |
9.94 |
6.56 |
|
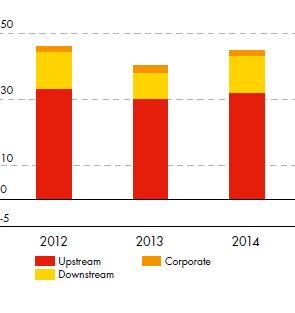
Net cash from operating activities |
45,044 |
40,440 |
46,140 |
36,771 |
27,350 |
|
Cash flow from operating activities per share ($) |
7.14 |
6.43 |
7.37 |
5.92 |
4.46 |
|
Dividend per share ($) |
1.88 |
1.80 |
1.72 |
1.68 |
1.68 |
|
Dividend per ADS ($) |
3.76 |
3.60 |
3.44 |
3.36 |
3.36 |
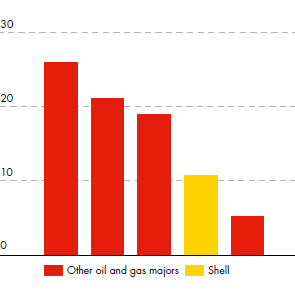
CCS earnings$ billion

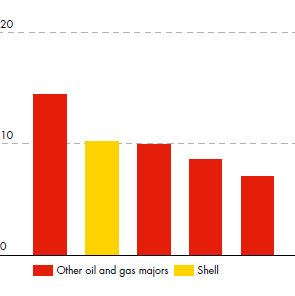
Net cash from operating activities$ billion


