HIGHLIGHTS
- Produced 3.3 million boe/d of oil and gas, a 3% increase excluding the effect of divestments and exits.
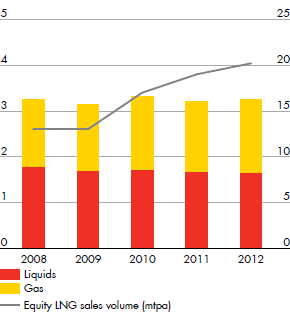
- Sold 20.2 million tonnes of liquefied natural gas (LNG).
- Added 4 billion boe of resources in 2012 from exploration and acquisitions, compared with 1.2 billion boe of production.
- Made seven notable new discoveries and appraisals in conventional exploration, including an appraisal at Appomattox, which now has more than 500 million boe potential.
- Took final investment decisions on Forcados Yokri and Southern Swamp in Nigeria; Tempa Rossa in Italy; Malikai in Malaysia; and North American liquids-rich shales.
- Increased participation in the Draugen, Schiehallion and Beryl fields in the UK North Sea.
- Acquired liquids-rich shales acreage in the Permian basin, Texas.
- Divested three oil mining leases onshore Nigeria for a total consideration of more than $1 billion.
- Found strategic partners for the Groundbirch project and Prelude FLNG, and diluted our stakes in these projects.
- Signed the first ever shale gas production sharing contract in China with CNPC.
- Announced a proposal for developing an LNG export facility in Western Canada with strategic partners called LNG Canada.
| Download XLS |
|
KEY STATISTICS | |||||||||||||
|---|---|---|---|---|---|---|---|---|---|---|---|---|---|
|
|
2012 |
2011 |
2010 |
2009 |
2008 | ||||||||
| |||||||||||||
|
Upstream earnings ($ million) |
|
|
|
|
| ||||||||
|
Upstream International |
21,245 |
19,697 |
15,205 |
7,209 |
19,298 | ||||||||
|
Upstream Americas |
917 |
4,758 |
730 |
1,145 |
7,208 | ||||||||
|
Total Upstream earnings ($ million) |
22,162 |
24,455 |
15,935 |
8,354 |
26,506 | ||||||||
|
of which Integrated gas |
10,978 |
7,279 |
5,727 |
1,785 |
4,093 | ||||||||
|
Total Upstream earnings |
20,025 |
20,600 |
14,442 |
8,488 |
23,019 | ||||||||
|
Upstream cash flow from operations |
32,951 |
33,281 |
24,526 |
18,445 |
35,448 | ||||||||
|
Liquids production (thousand b/d) [B][C] |
1,508 |
1,551 |
1,637 |
1,600 |
1,693 | ||||||||
|
Natural gas production (million scf/d) [B] |
9,449 |
8,986 |
9,305 |
8,483 |
8,569 | ||||||||
|
Synthetic crude oil production |
125 |
115 |
72 |
80 |
| ||||||||
|
Mined oil sands production (thousand b/d) [B] |
|
|
|
|
78 | ||||||||
|
Total production (thousand boe/d) [B][D] |
3,262 |
3,215 |
3,314 |
3,142 |
3,248 | ||||||||
|
Equity sales of liquefied natural gas (LNG) |
20.2 |
18.8 |
16.8 |
13.4 |
13.1 | ||||||||
|
Upstream net capital investment ($ million) |
25,320 |
19,083 |
21,222 |
22,326 |
28,257 | ||||||||
|
Upstream capital employed ($ million) |
139,277 |
126,437 |
113,631 |
98,826 |
83,997 | ||||||||
|
Upstream employees (thousands) |
26 |
27 |
26 |
23 |
22 | ||||||||
UPSTREAM EARNINGS [A]$ billion
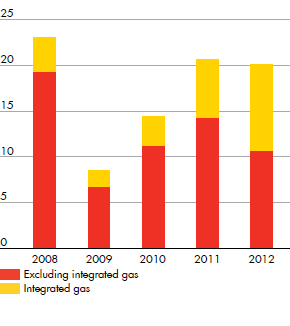
- [A]
- Excluding identified items.
PRODUCTIONmillion boe/d mtpa