HIGHLIGHTS
- Inaugurated the expansion of our joint-venture refinery in Port Arthur, Texas, more than doubling crude oil distillation capacity there to 620 thousand b/d. It is flexible, able to process many types of crude oil and vary the mix of final products based on demand.
- In Australia, the Clyde refinery was converted to a terminal.
- Optimised ethylene delivery in Supply and distribution, resulting in a 20% increase in throughput capacity and improved operating flexibility.
- Continued to demonstrate innovation in fuels technology and superior customer experience in Retail with the first launch of Shell V-Power Nitro+, which is now available in six countries. In China we also had the first launch of Shell V-Power in Tianjin province and signed an agreement with China Union Pay to enable faster and more convenient payment options.
- Making good progress with the Raízen biofuels joint venture in Brazil, which has a 35 thousand b/d ethanol production capacity. In its first full year of operations, Raízen contributed more than 10% to our 2012 Oil products earnings.
- Bought the remaining shares in Gasnor, a Norwegian supplier of LNG for shipping and trucking. It gives us a foothold in a growing market for cleaner-burning gas as a transport fuel.
- Entered into an agreement with joint venture partners to purchase assets at the Coryton refinery in Essex and worked with our partners to develop a state-of-the-art import and distribution terminal. This investment will support growth in our UK retail business, which acquired 253 retail sites in 2011.
- Agreed to acquire Neste Oil Corporation’s network of 105 retail sites in Poland. These sites are unmanned and located in major cities throughout the country.
- Progressed the proposed world-scale petrochemicals project in Ras Laffan Industrial City in Qatar by awarding, with venture partner Qatar Petroleum, the front-end engineering and design contract.
- Agreed with our partner SABIC to expand Sadaf, our long-standing Chemicals joint venture in Saudi Arabia – including proposed construction of new derivative units.
| Download XLS |
|
KEY STATISTICS | |||||||||
|---|---|---|---|---|---|---|---|---|---|
|
|
2012 |
2011 |
2010 |
2009 |
2008 | ||||
| |||||||||
|
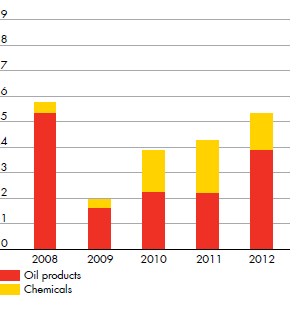
Downstream CCS earnings ($ million) |
|
|
|
|
| ||||
|
Oil products |
3,959 |
2,235 |
1,439 |
(58) |
5,153 | ||||
|
Chemicals |
1,391 |
2,054 |
1,511 |
316 |
156 | ||||
|
Total Downstream earnings ($ million) [A] |
5,350 |
4,289 |
2,950 |
258 |
5,309 | ||||
|
Total Downstream earnings excluding identified items |
5,311 |
4,274 |
3,873 |
1,940 |
5,744 | ||||
|
Downstream cash flow from operations ($ million) [B] |
8,028 |
8,746 |
8,138 |
5,839 |
1,750 | ||||
|
Oil products sales volumes (thousand b/d) |
6,235 |
6,196 |
6,460 |
6,156 |
6,568 | ||||
|
Chemicals sales volumes (thousand tonnes) |
18,669 |
18,831 |
20,653 |
18,311 |
20,327 | ||||
|
Refinery processing intake (thousand b/d) |
2,819 |
2,845 |
3,197 |
3,067 |
3,388 | ||||
|
Refinery availability (%) |
93 |
92 |
92 |
93 |
91 | ||||
|
Chemical plant availability (%) |
91 |
89 |
94 |
92 |
94 | ||||
|
Downstream net capital investment ($ million) |
4,275 |
4,342 |
2,358 |
6,232 |
3,104 | ||||
|
Downstream capital employed ($ million) |
71,889 |
71,976 |
67,287 |
62,632 |
54,050 | ||||
|
Downstream employees (thousands) |
48 |
51 |
59 |
62 |
64 | ||||
DOWNSTREAM CCS EARNINGS [A]$ billion

- [A]
- Excluding identified items.
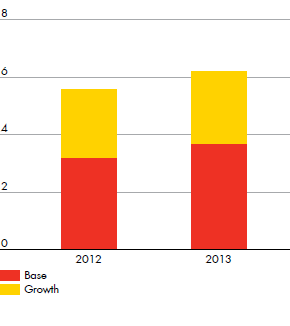
DOWNSTREAM ORGANIC CAPITAL INVESTMENT$ billion


