We continuously seek to improve our operating performance, with an emphasis on health, safety and environment, asset performance and operating costs. For 2015, we will continue to focus on the three key themes set out in 2014: improving our financial performance; enhancing our capital efficiency; and continuing our focus on project delivery.
In 2015, we expect organic capital investment to be lower than 2014 levels of around $35 billion. We are considering further reductions to capital investment should the evolving market outlook warrant that step, but are aiming to retain growth potential for the medium term. Asset sales are a key element of our strategy, improving our capital efficiency by focusing our investment on the most attractive growth opportunities. Proceeds from sales of non-strategic assets in 2014, and from the initial public offering of the US midstream master limited partnership, totalled $15 billion, successfully completing our divestment programme for 2014-2015. The completed divestment programme will result in various production and tax effects in 2015. We also expect higher levels of downtime in 2015, especially in Upstream and Chemicals, driven by increased maintenance activities. We will continue the 2014 initiatives that are expected to improve our North America resources plays and Oil Products businesses. We have new initiatives underway in 2015 that are expected to improve our upstream engine and resources plays outside the Americas. The focus of these initiatives will be on the profitability of our portfolio and growth potential.
Shell has built up a substantial portfolio of project options for future growth. This portfolio has been designed to capture energy price upside and manage Shell’s exposure to industry challenges from cost inflation and political risk. Today’s lower oil prices create both the need and opportunity to reduce our own costs and to take costs out of the supply chain.
The statements in this “Strategy and outlook” section, including those related to our growth strategies and our expected or potential future cash flow from operations, capital investment, divestment proceeds and production, are based on management’s current expectations and certain material assumptions and, accordingly, involve risks and uncertainties that could cause actual results, performance or events to differ materially from those expressed or implied herein.
Unrelenting focus on HSSE
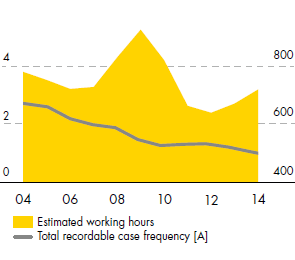
Goal zero on safety cases per million
working hoursmillion
working hours

- [A]
- Injuries in Shell-operated facilities per million working hours (employees and contractors).
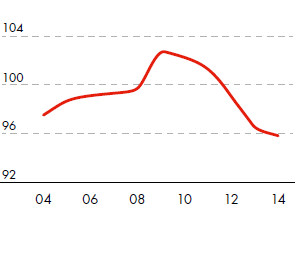
Energy intensity – refineries energy intensity index (EEITM)

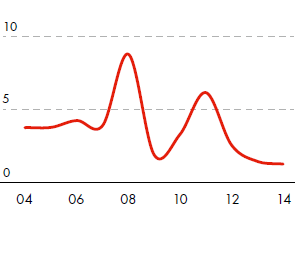
Spills – operational volume in thousand tonnes

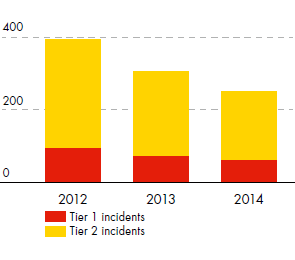
Process safety number of incidents


