HISTORICAL TSR PERFORMANCE OF ROYAL DUTCH SHELL PLC
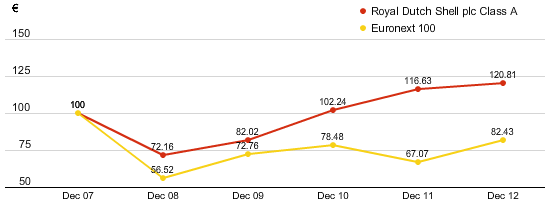
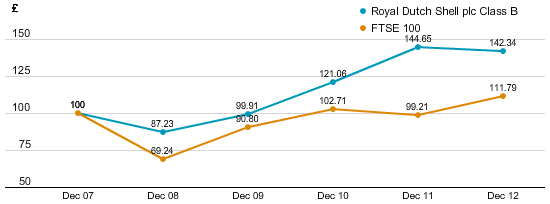
Growth in the value of a hypothetical €100 holding and £100 holding over five years. Euronext 100 and FTSE 100 comparison based on 30 trading day average values.
RDSA VERSUS EURONEXT 100Value of hypothetical €100 holding
RDSB VERSUS FTSE 100Value of hypothetical £100 holding
The following table shows the high, low and year-end prices of the Company’s registered ordinary shares:
- of €0.07 nominal value on the London Stock Exchange;
- of €0.07 nominal value on Euronext Amsterdam; and
- in the form of ADSs on the New York Stock Exchange (ADSs do not have a nominal value).
| Download XLS |
|
SHARE PRICES | |||||||
|---|---|---|---|---|---|---|---|
|
|
Euronext Amsterdam |
|
New York Stock Exchange | ||||
|
|
High |
Low |
Year-end |
|
High |
Low |
Year-end |
|
2008 |
29.63 |
16.25 |
18.75 |
|
88.73 |
41.62 |
52.94 |
|
2009 |
21.46 |
15.27 |
21.10 |
|
63.75 |
38.29 |
60.11 |
|
2010 |
25.28 |
19.53 |
24.73 |
|
68.54 |
49.16 |
66.78 |
|
2011 |
28.40 |
20.12 |
28.15 |
|
77.96 |
57.97 |
73.09 |
|
2012 |
29.18 |
24.30 |
25.98 |
|
74.51 |
60.62 |
68.95 |
|
|
|
|
|
|
|
|
|
|
|
London Stock Exchange |
|
New York Stock Exchange | ||||
|
|
High |
Low |
Year-end |
|
High |
Low |
Year-end |
|
2008 |
2,245 |
1,223 |
1,726 |
|
87.54 |
41.41 |
51.43 |
|
2009 |
1,897 |
1,315 |
1,812 |
|
62.26 |
37.16 |
58.13 |
|
2010 |
2,149 |
1,550 |
2,115 |
|
68.32 |
47.12 |
66.67 |
|
2011 |
2,476 |
1,768 |
2,454 |
|
78.75 |
58.42 |
76.01 |
|
2012 |
2,499 |
2,020 |
2,175 |
|
77.52 |
63.05 |
70.89 |
