| Download XLS |
|
KEY STATISTICS | |||||||||||||||
|---|---|---|---|---|---|---|---|---|---|---|---|---|---|---|---|
|
|
2013 |
2012[A] |
2011[A] |
2010[A] |
2009[A] | ||||||||||
|
|||||||||||||||
|
Upstream earnings ($ million) |
|
|
|
|
|
||||||||||
|
Upstream International |
16,334 |
21,169 |
19,649 |
15,205 |
7,209 |
||||||||||
|
Upstream Americas |
(3,696) |
1,075 |
4,817 |
730 |
1,145 |
||||||||||
|
Total Upstream earnings ($ million) |
12,638 |
22,244 |
24,466 |
15,935 |
8,354 |
||||||||||
|
of which Integrated gas |
9,390 |
10,990 |
7,280 |
5,727 |
1,785 |
||||||||||
|
Total Upstream earnings excluding identified items ($ million) |
15,117 |
20,107 |
20,611 |
14,442 |
8,488 |
||||||||||
|
Upstream cash flow from operations ($ million) |
30,114 |
33,061 |
30,579 |
24,872 |
19,935 |
||||||||||
|
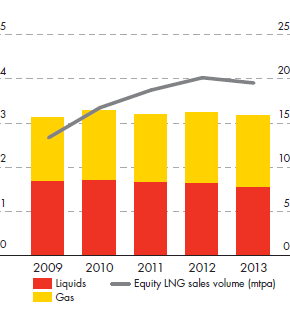
Liquids production (thousand b/d) [B][C] |
1,415 |
1,508 |
1,551 |
1,637 |
1,600 |
||||||||||
|
Natural gas production (million scf/d) [B] |
9,616 |
9,449 |
8,986 |
9,305 |
8,483 |
||||||||||
|
Synthetic oil production (thousand b/d) [B] |
126 |
125 |
115 |
72 |
80 |
||||||||||
|
Total production (thousand boe/d) [B][D] |
3,199 |
3,262 |
3,215 |
3,314 |
3,142 |
||||||||||
|
Equity sales of liquefied natural gas (million tonnes) |
19.6 |
20.2 |
18.8 |
16.8 |
13.4 |
||||||||||
|
Upstream capital investment ($ million) [E] |
40,303 |
31,179 |
23,363 |
25,709 |
23,951 |
||||||||||
|
Upstream capital employed ($ million) |
153,792 |
134,974 |
123,116 |
111,570 |
96,261 |
||||||||||
|
Upstream employees (thousands) |
31 |
26 |
27 |
26 |
23 |
||||||||||
Upstream earnings [A] $ billion
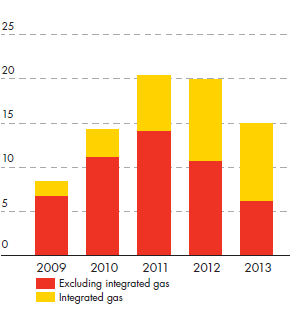
- [A]
- Excluding identified items.
Production million boe/d mtpa