 Our people
 Sustainable development goals
 About our data
 Electricity
Greenhouse gas emissions
We are taking action to manage the emissions from our own operations and the emissions from the energy we use in our operations.
Greenhouse gas (GHG) and energy management plans for facilities and projects help drive our emissions performance through a range of actions. These include using more energy-efficient equipment and installing power from renewable sources, and considering the potential for carbon capture and storage in the design of our new and largest projects (see Energy efficiency in our operations).
For example, the Moerdijk chemicals site in the Netherlands has installed a solar power plant with a peak capacity of around 27 megawatts from 76,000 solar panels, comparable to the electricity use of about 9,000 Dutch households.
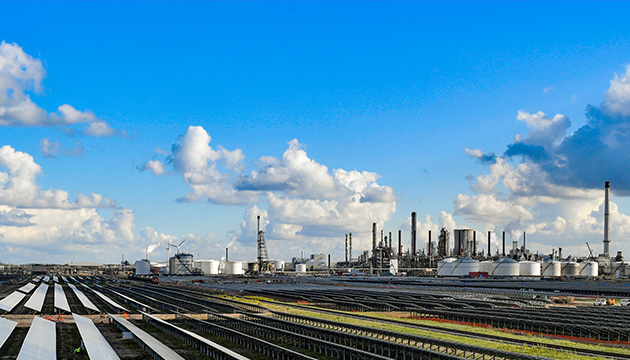
The Moerdijk solar power plant in the Netherlands
Greenhouse gas management
GHG and energy management plans must include the sources of GHG emissions, as well as a forecast of expected emissions at the site for at least 10 years.
Projects under development that are expected to have a material GHG footprint must meet carbon intensity performance standards or industry benchmarks.
To assess the resilience of proposed projects, we consider potential costs associated with operational GHG emissions. Consistent with our desire to stay in step with society’s progress towards the goals of the Paris Agreement, in 2018 we moved away from using a flat project screening value (PSV) of $40/tonne of carbon dioxide (CO2) equivalent to country-specific estimates of future carbon costs. These estimates were developed using the current Nationally Determined Contributions submitted by countries as part of the Paris Agreement. Accordingly, we believe they more accurately reflect society’s current implementation of the Paris Agreement rather than a flat $40/tonne PSV. By 2050, our estimates for some countries increase to $85/tonne of GHG emissions. For more details, see Climate change and energy transition in our Annual Report.
Shell has also developed and implemented a comprehensive CO2 and energy management information system (CEMIS) that supports our facilities, for example, by analysing real-time data to highlight maintenance gaps and monitor performance. CEMIS is primarily deployed in liquefied natural gas and targeted Upstream facilities.
Greenhouse gas emission performance
Shell tracks emissions released by our facilities and works to reduce emissions from our operations. We report our GHG emissions in line with the recommendations of the Intergovernmental Panel on Climate Change. Shell’s Health, Safety, Security, Environment and Social Performance (HSSE&SP) Control Framework defines standards and accountabilities at each level of the organisation and sets out the procedures people are required to follow.
Direct greenhouse gas emissions
million tonnes CO2 equivalent
Enlarge image
Our direct GHG emissions decreased from 73 million tonnes of CO2 equivalent in 2017 to 71 million tonnes of CO2 equivalent in 2018.
GHG movements from 2017 to 2018 [A]
million tonnes CO2 equivalent

[A] Direct and indirect GHG emissions from imported energy
[B] Does not include 1 million tonnes of CO2 captured and sequestered by our Quest CCS project in Canada in 2018
The main reasons for the decrease in our greenhouse gas emissions in 2018 were divestments (for example in Argentina, Canada, Gabon, Iraq, Malaysia and the UK). These decreases were partly offset by inclusion of the assets previously operated by the Motiva Enterprises LLC joint venture in our data for the full year in 2018, increased production at the Pearl gas-to-liquids plant in Qatar and the start-up of the Prelude floating liquefied natural gas facility in Australia.
In 2018, more than 55% of our direct greenhouse gas emissions came from our refineries and chemical plants. The production of oil, gas and gas-to-liquids products accounted for around 40% of our greenhouse gas emissions, and our shipping activities accounted for around 3%. We continue to work on improving operational performance and energy efficiency to manage greenhouse gas emissions.
The indirect greenhouse gas emissions associated with the generation of the energy we purchased (electricity, heat and steam) were 11 million tonnes on a CO2-equivalent basis in 2018 compared with 12 million tonnes CO2 equivalent in 2017. The decrease was in part driven by the exclusion of oil sands mining when operatorship was transferred to another company, Canadian Natural, in 2017. These emissions were calculated using a market-based approach, as defined by the World Resources Institute Greenhouse Gas Protocol.
We estimate that the CO2 equivalent emissions from the use of our refinery and natural gas products by others were around 599 million tonnes in 2018. Read more about our Net Carbon Footprint at www.shell.com/ncf.
We use the previous year’s GHG emissions as our base year to compare our performance over time. To maintain a meaningful and consistent year-to-year comparison, we may need to recalculate the base year if it is affected by major changes, for example, if significant emissions-generating activities are transferred to another company as a result of a divestment. Our 2017 base year GHG emissions did not change by more than 5% in 2018 and therefore the base year emissions have not been recalculated.
Read more at www.shell.com/ghg.