 Climate change
 Sustainable development goals
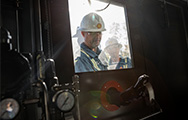 Safety
 About our data
Safety data
|
|
2019 |
2018 |
2017 |
2016 |
2015 |
2014 |
2013 |
2012 |
2011 |
2010 |
||||||||
|---|---|---|---|---|---|---|---|---|---|---|---|---|---|---|---|---|---|---|---|
|
Fatalities |
|
|
|
|
|
|
|
|
|
|
||||||||
|
Total number |
7 |
2 |
2 |
3 |
7 |
5 |
5 |
8 |
6 |
12 |
||||||||
|
Employees |
3 |
0 |
0 |
0 |
1 |
3 |
0 |
3 |
1 |
0 |
||||||||
|
Contractors |
4 |
2 |
2 |
3 |
6 |
2 |
5 |
5 |
5 |
12 |
||||||||
|
Fatal accident rate (FAR) |
1.3 |
0.4 |
0.4 |
0.5 |
1.1 |
0.7 |
0.8 |
1.3 |
1.0 |
1.6 |
||||||||
|
Fatalities per 100 million working hours (employees and contractors) |
|
|
|
|
|
|
|
|
|
|
||||||||
|
Injuries and process safety incidents |
|
|
|
|
|
|
|
|
|
|
||||||||
|
Total recordable case frequency (TRCF) |
0.9 |
0.9 |
0.8 |
1.0 |
0.9 |
1.0 |
1.2 |
1.3 |
1.2 |
1.2 |
||||||||
|
Injuries per million working hours (employees and contractors) |
|
|
|
|
|
|
|
|
|
|
||||||||
|
Lost time injury frequency (LTIF) |
0.3 |
0.3 |
0.2 |
0.3 |
0.3 |
0.3 |
0.4 |
0.3 |
0.4 |
0.3 |
||||||||
|
Lost time injuries per million working hours (employees and contractors) |
|
|
|
|
|
|
|
|
|
|
||||||||
|
Operational process safety events |
|
|
|
|
|
|
|
|
|
|
||||||||
|
Tier 1 [B] |
41 |
35 |
49 |
41 |
51 |
57 |
65 |
91 |
n/c |
n/c |
||||||||
|
Tier 2 [B] |
89 |
86 |
117 |
110 |
169 |
194 |
246 |
308 |
n/c |
n/c |
||||||||
|
Illnesses |
|
|
|
|
|
|
|
|
|
|
||||||||
|
Total recordable occupational illness frequency (TROIF) |
0.5 |
0.4 |
0.3 |
0.4 |
0.6 |
1.0 |
0.8 |
0.5 |
0.7 |
0.8 |
||||||||
|
Illnesses per million working hours (employees only) |
|
|
|
|
|
|
|
|
|
|
||||||||
|
Security |
|
|
|
|
|
|
|
|
|
|
||||||||
|
Using armed security (% of countries) |
20 |
21 |
14 |
17 |
19 |
24 |
19 |
17 |
14 |
9 |
||||||||
|
Using armed company security (% of countries) |
1 |
3 |
1 |
1 |
1 |
1 |
3 |
0 |
1 |
1 |
||||||||
|
Using armed contractor security (% of countries) |
11 |
10 |
3 |
7 |
8 |
10 |
8 |
10 |
9 |
6 |
||||||||
|
|||||||||||||||||||