 Climate change
 Sustainable development goals
 Safety
 About our data
Energy efficiency in our operations
Special report


Improving the energy efficiency of Shell-operated facilities is one of the ways we manage our greenhouse gas emissions. We also increasingly work to avoid waste by ensuring what we use is designed to last longer and to be reused, repurposed or recycled.
Boosting refinery and chemical plant efficiency
We are investing in co-generation plants that provide our refineries and chemical plants with on-site power in the form of both electricity and recycled heat. We are also helping communities near us to reduce emissions by passing on waste heat so residents rely less on the power grid.
In Rotterdam, the Netherlands, waste heat from our Pernis refinery helps warm about 16,000 homes, helping to avoid around 35,000 tonnes of carbon dioxide (CO2) emissions a year. In the USA, we are building a 250 megawatt (MW) co-generation power plant at our Pennsylvania chemicals facility that will also supply electricity to local homes.
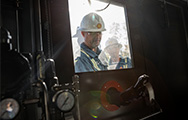
We have reduced fuel consumption by about 40% and air emissions by around 20-25% at our Appomattox platform in the US Gulf of Mexico by using a combined-cycle power plant. This operates far more efficiently by extracting energy that would otherwise be wasted as exhaust heat from a regular power plant.
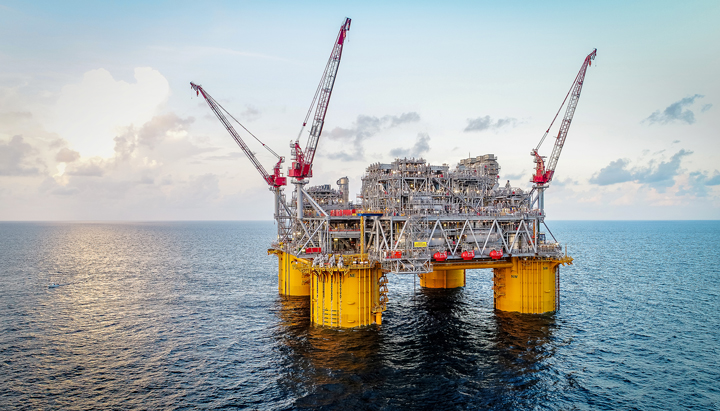
Installing a more efficient power plant at the Appomattox deep-water oil and gas project in the USA has helped cut fuel consumption by around 40% and air emissions by about 20-25%.
In Germany, our Rhineland refinery is building a modernised power plant that is expected to improve energy efficiency and lead to a reduction of 100,000 tonnes of CO2 emissions a year. We are also building a hydrogen electrolysis unit at the Rhineland site to generate hydrogen from electricity rather than natural gas, which will help to further reduce CO2 emissions.
Reducing electricity consumption
At our lubricant plants, we are using technology to help track and reduce electricity consumption. For example, in 2019, we began using a monitoring system at our Nangang, Zhapu and Zhuhai blending plants in China. This is a web-based tool that identifies waste and opportunities to improve energy efficiency in real time.
We piloted the tool at our Tianjin lubricant plant in China in 2018 and the result was an 8.5% reduction in electricity consumption compared to 2017. We are planning to introduce the tool more widely.
Solar energy at sites
We are increasing solar power at our own offices, retail sites, distribution terminals, refineries and offshore platforms.
In 2019, we installed solar panels at seven lubricant plants in China, India, Italy, Singapore and Switzerland. Combined, the panels are expected to generate more than 7,500 MW an hour of electricity a year and can avoid around 4,500 tonnes of CO2-equivalent emissions a year, which is equivalent to taking about 2,600 cars off the road.
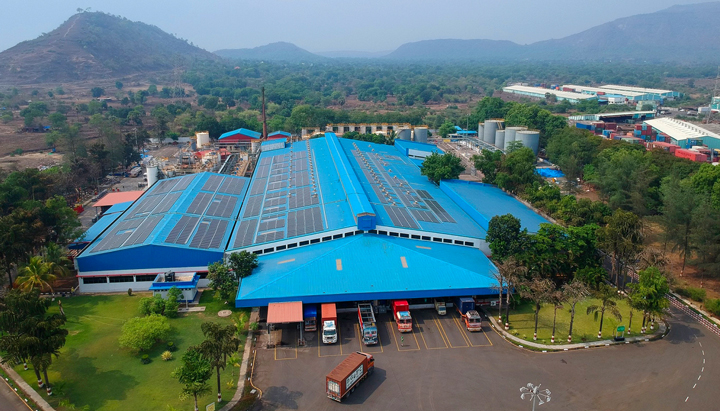
Our lubricant oil blending plant in Taloja, India, is now one of seven of our lubricants facilities around the world that benefit from solar power.
The solar energy generated will be used to help power operations, lower operating costs and reduce our reliance on the power grid.
Energy intensity performance
The main metric we use to measure our performance is energy intensity: the amount of energy consumed for every unit of output.
The refining energy intensity index in 2019 was 94.4 compared with 94.3 in 2018.
In 2019, we moved from Chemical Energy Index to chemicals steam cracker energy intensity (measured in gigajoules per tonne of high value chemical production (GJ/tonne HVC)) as a primary measure of energy intensity for our steam cracker units. Chemical steam cracker energy intensity in 2019 was 19.7 GJ/tonne HVC, up from 18.3 GJ/tonne HVC in 2018, mainly as a result of turnarounds at three of our sites.
Energy intensity – chemical plants
Chemicals energy index [A]
Enlarge image
[A] Methodology was updated in 2015. Data for previous years are not directly comparable.
Energy intensity – refining
Refinery energy index [A]
Enlarge image
[A] Indexed to 2002; based on Solomon EIITM methodology.
In 2019, the overall energy intensity for the production of oil and gas in our Upstream and Integrated Gas businesses (excluding liquefied natural gas (LNG) and gas-to-liquids (GTL)) increased slightly compared with 2018.
We expect it will be difficult to maintain the energy intensity levels of recent years, as existing fields age and new production comes from more energy-intensive sources. This may increase our upstream energy intensity over time.
Energy intensity – upstream
(Excluding oil sands, GTL and LNG) gigajoules/tonne production [A]
Enlarge image
[A] Methodology was updated in 2012. Data for previous years are not directly comparable.