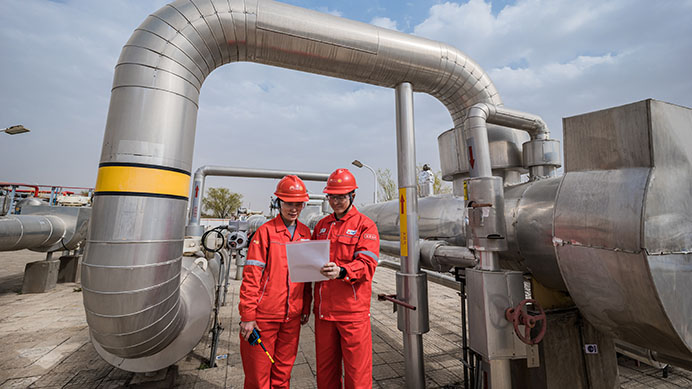


Preparing for emergencies
We prepare and practise our emergency response to incidents, such as a spill or a fire. This involves working closely with local emergency services and regulatory agencies to jointly test our plans and procedures.
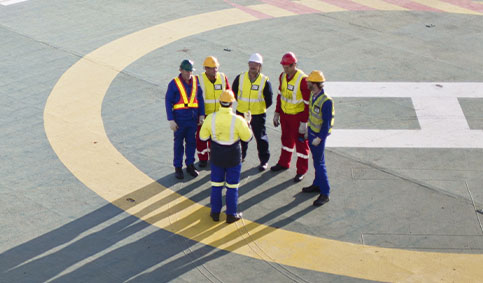
Shell requires key operating assets to test their emergency response preparedness every three years. In 2023, we held four large-scale emergency response exercises at certain assets we operate in Trinidad and Tobago, Singapore, the UK and the USA. We also supported one large-scale emergency response exercise at an asset in Argentina, owned and operated by Raízen, one of our joint ventures (Shell interest 44%).
We have set up three regional Emergency Response Leadership Councils for the Americas; Asia-Pacific; and Europe, the Middle East and Africa. The councils bring together experts from different teams that need to be able to work together seamlessly in case of emergencies. In 2023, the councils’ annual conferences covered a variety of topics such as business continuity, cyber security, performance under stress, battery storage emergencies, use of drones and competence development.
Spills
We design, operate and maintain our facilities with the intention of avoiding spills. To minimise the risk of spills, Shell has routine programmes in place to help reduce failures and maintain the reliability of facilities and pipelines.
However, spills still occur for reasons such as operational failure, accidents or unusual corrosion.
In 2023, there were 70 operational spills of more than 100 kilograms compared with 55 in 2022. The volume of operational spills of oil and oil products in 2023 was 0.37 thousand tonnes, compared with 0.06 thousand tonnes in 2022.
In 2023, there were no Level 1 or Level 2 well-control incidents at Shell-operated ventures.
Spills – operational [A]
In 2023, 140 spills were caused by sabotage, compared with 75 in 2022. Of those, 139 were in Nigeria and 1 in Australia. The volume of spills also increased to 1.4 thousand tonnes from 0.6 thousand tonnes in 2022.
Spills – sabotage [A] [B]
[B] All sabotage- and theft-related spills occurred in Nigeria except in 2015 (0.005 thousand tonnes), 2016 (0.001 thousand tonnes) and 2023 (0.0002 thousand tonnes).
Read about our emergency response procedures at www.shell.com/process-safety.