Reducing carbon intensity
The biggest driver for reducing our net carbon intensity is increasing the sales of and demand for low-carbon energy. The chart below illustrates how changes in the volume of products and services we sell could result in net carbon intensity reductions through to 2030. The change in our sales of these products and services will also reflect the development and adoption of new technologies and infrastructure, and the adoption of public policies designed to encourage the energy transition.
Working to reduce our net carbon intensity
Net carbon intensity in gCO2e/MJ [A]
[B] Hydrocarbon sales reflect the effect of lower sales of oil products, and higher sales of natural gas. Emissions associated with gas are lower than those of oil products.
[C] Electricity sales show the expected growth of our integrated power business and increasing sales of renewable electricity.
[D] Sales of low-carbon fuels reflect higher sales of biofuels and hydrogen, which are low- and zero-carbon products.
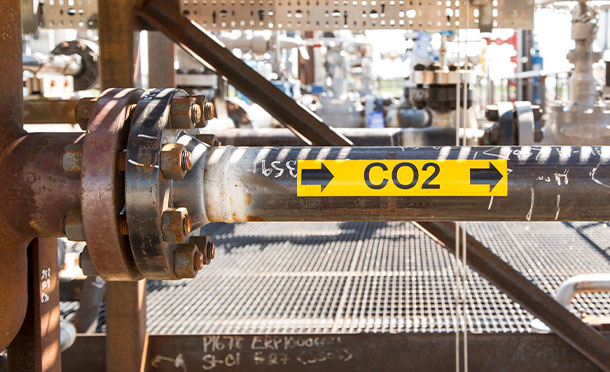
[E] Carbon capture and storage (CCS) reduces carbon emissions by capturing them at source.
[F] Carbon credits such as nature-based solutions can be used to offset remaining carbon emissions, particularly in hard-to-abate sectors such as aviation and industries including cement and steel.
Carbon intensity performance
In 2022, Shell’s net carbon intensity was 76 grams of carbon dioxide equivalent per megajoule of energy (gCO2e/MJ), a 1.3% decrease from the previous year and a 3.8% reduction compared with 2016, the reference year. The decrease in Shell’s net carbon intensity in 2022 was primarily due to an increased proportion of renewable power and corresponding reduction in the carbon intensity of our power sales. Shell’s 2022 net carbon intensity includes 4.1 million tonnes of carbon credits, compared with 5.1 million tonnes which were included in Shell’s 2021 net carbon intensity. The net carbon intensity only includes carbon credits that are retired against energy products.
Share of energy delivered per energy product type [A]-[F]
[B] Total volume of energy products sold by Shell, aggregated on an energy basis, with electricity represented as fossil equivalents. This value is derived from energy product sales figures disclosed by Shell in the Annual Report and the Sustainability Report.
[C] Lower heating values are used for the energy content of the different products and a fossil-equivalence approach is used to account for electrical energy, so that it is assessed on the same basis as our other energy products.
[D] The net carbon intensity calculation uses Shell’s energy product sales volumes data, as disclosed in the Annual Report and Sustainability Report. This excludes certain contracts held for trading purposes and reported net rather than gross. Business-specific methodologies to net volumes have been applied in oil products and pipeline gas and power. Paper trades that do not result in physical product delivery are excluded. Retail sales volumes from markets where Shell operates under trademark licensing agreements are also excluded from the scope of Shell´s carbon intensity metric.
[E] Emissions included in the carbon intensity of power have been calculated using the market-based method.
[F] The carbon intensity of biofuels provided in the graph “Share of energy delivered per energy product type” reflects the global average for biofuels sold by Shell for 2022.


