Investments and returns
Since the first quarter of 2022, we have reported separately on the performance of our five business segments [A]:
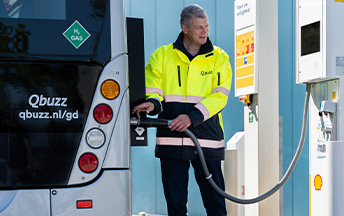
- Our Marketing business has targeted returns of 15-25%. It comprises Mobility, Lubricants, and Sectors and Decarbonisation. Mobility operates Shell's retail network, including electric vehicle charging services. Lubricants produces, markets and sells lubricants for road transport, and machinery used in manufacturing, mining, power generation, agriculture and construction. Sectors and Decarbonisation sells fuels, speciality products and services, including energy solutions that help customers reduce emissions in the aviation, marine, commercial road transport and agricultural sectors, among others.
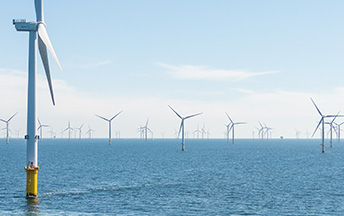
- Our Renewables and Energy Solutions business has targeted returns of more than 10% [B]. It includes renewable power generation, the marketing and trading of power and pipeline gas, as well as carbon credits, and digitally enabled customer solutions. Renewables and Energy Solutions also includes the production and marketing of hydrogen, development of commercial carbon capture and storage hubs, investment in nature-based projects that avoid or reduce carbon emissions (Nature-based solutions), and Shell Ventures, which invests in companies that work to accelerate the energy and mobility transformation.
- Our Integrated Gas business has targeted returns of 14-18%. It includes liquefied natural gas (LNG), conversion of natural gas into gas-to-liquids (GTL) fuels and other products. It includes natural gas and liquids exploration and extraction, and the operation of the upstream and midstream infrastructure necessary to deliver these to market. Integrated Gas also includes the marketing, trading and optimisation of LNG, including LNG as a fuel for heavy-duty vehicles.
- Our Chemicals and Products business has targeted returns of 10-15%. It includes chemicals manufacturing plants with their own marketing network, and refineries which turn crude oil and other feedstocks into a range of oil products. These are moved and marketed around the world for domestic, industrial and transport use. The business also includes pipelines, trading of crude oil, oil products and petrochemicals, and oil sands activities, which involves the extraction of bitumen from mined oil sands and its conversion into synthetic oil.
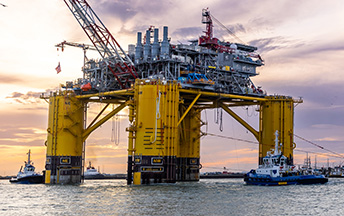
- Our Upstream business has targeted returns of 20-25%. It explores for and extracts crude oil, natural gas and natural gas liquids. It also markets and transports oil and gas, and operates the infrastructure necessary to deliver them to the market. Shell’s Upstream business delivers reliable energy from conventional oil and gas operations, as well as deep-water exploration and production activities. We are focusing our Upstream portfolio to become more resilient, prioritising value over volume to provide the energy the world needs today whilst funding the energy system of tomorrow.
For all these businesses, our target returns consider the risks and uncertainties associated with our investments, and the scale of spending that is required to develop opportunities. For example, in our Upstream business, they reflect the costs of exploration, feasibility studies and construction, as well as risks linked to commodity prices.
In 2022, our cash capital expenditure [C] was around $25 billion and our operating expenses were around $39 billion. The table below shows how much we spent and the cash flow from operations in 2021 and 2022 across our businesses.
[A] On January 31, 2023, we announced that our Integrated Gas and Upstream businesses will be combined to form a new Integrated Gas and Upstream Directorate. The Downstream business will be combined with Renewables and Energy Solutions to form a new Downstream and Renewables Directorate. These changes are expected to take effect on July 1, 2023 and will not affect Shell’s financial reporting segments in 2023. Please refer to the “Our organisation” section in the Annual Report and Accounts 2022.
[B] The IRR target for Renewables and Energy Solutions covers Integrated Power only. The target of more than 10% relates to the integrated value chain returns over time and includes equity returns from minority investments.
[C] Please refer to the Annual Report and Accounts 2022 for the definitions of cash capital expenditure and operating expenses.
Net debt end 2022 $45 billion |
Cash capital expenditure |
Operating expenses |
Cash flow from operations (CFFO) $ billion |
|||||||
|---|---|---|---|---|---|---|---|---|---|---|
2022 |
2021 |
2022 |
2021 |
2022 |
2021 |
|||||
Marketing |
20% |
12% |
21% |
20% |
2.4 |
5.0 |
||||
Renewables and Energy Solutions |
14% |
12% |
9% |
7% |
(6.4) [B] |
0.5 |
||||
Integrated Gas |
17% |
18% |
13% |
13% |
27.7 |
13.2 |
||||
Chemicals and Products |
16% |
27% |
28% |
28% |
12.9 |
3.7 |
||||
Upstream |
33% |
32% |
29% |
32% |
29.6 |
21.6 |
||||
|
||||||||||