


Upstream
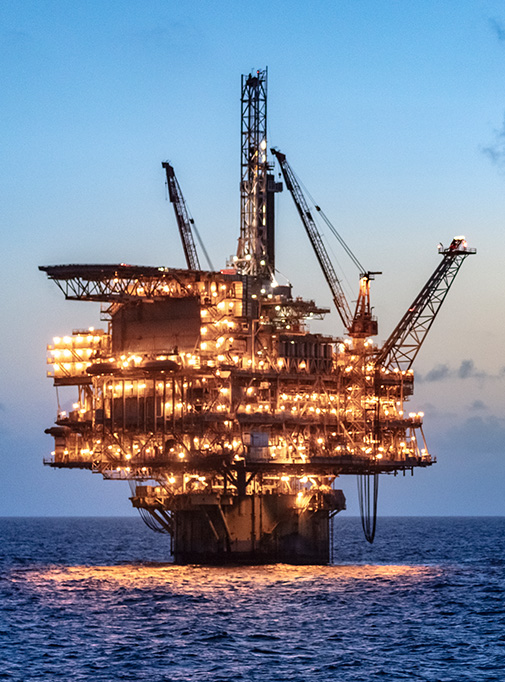
Upstream explores for and extracts crude oil, natural gas and natural gas liquids. It also markets and transports oil and gas, and operates the infrastructure necessary to deliver them to the market. Shell’s Upstream business delivers reliable energy from conventional oil and gas operations, as well as deep-water exploration and production activities. We are focusing our Upstream portfolio to become more resilient, prioritising value over volume to provide the energy the world needs today whilst funding the energy system of tomorrow.
($ billion) 16.2 2021: 9.6
($ billion) 17.3 2021: 8.0
($ billion) 29.6 2021: 21.6
(thousand boe/d) 1,897 2021: 2,178
|
|
$ million, except where indicated |
|||||
|---|---|---|---|---|---|---|---|
|
2022 |
2021 |
2020 |
||||
Segment earnings/(loss) |
16,222 |
9,603 |
(9,300) |
||||
Including: |
|
|
|
||||
Revenue (including inter-segment sales) |
60,637 |
44,971 |
27,763 |
||||
Share of profit of joint ventures and associates |
2,111 |
632 |
(7) |
||||
Interest and other income |
726 |
4,592 |
541 |
||||
Operating expenses [B] |
10,364 |
10,324 |
10,650 |
||||
Underlying operating expenses [B] |
10,802 |
10,086 |
9,894 |
||||
Exploration |
1,472 |
1,301 |
1,131 |
||||
Depreciation, depletion and amortisation |
10,334 |
13,485 |
21,079 |
||||
Taxation charge/(credit) |
14,070 |
6,057 |
(103) |
||||
Identified Items [B] |
(1,096) |
1,587 |
(6,874) |
||||
Adjusted Earnings [B] |
17,319 |
8,015 |
(2,426) |
||||
Adjusted EBITDA [B] |
42,100 |
27,170 |
13,045 |
||||
Capital expenditure |
8,020 |
6,277 |
6,714 |
||||
Cash capital expenditure [B] |
8,143 |
6,168 |
7,099 |
||||
Oil and gas production available for sale (thousand boe/d) |
1,897 |
2,178 |
2,324 |
||||
|
|||||||
Business conditions
For the business conditions relevant to Upstream, see “Market overview”.
Production available for sale
In 2022, production was 692 million barrels of oil equivalent (boe), or 1,897 thousand boe per day (boe/d), compared with 795 million boe, or 2,178 thousand boe/d in 2021. Liquids production decreased by 12% and natural gas production decreased by 15%, compared with 2021.
Total production, compared with 2021, decreased as a result of divestments and scheduled maintenance. The impact of field decline was more than offset by growth from new fields.
Controllable availability of 84.7% was driven mainly by unscheduled deferments in Nigeria (Forcados Oil terminal repairs), extended turnarounds and reliability in the UK (Pierce FPSO, Shearwater and Gannet).