


Integrated Gas
Integrated Gas (IG) includes liquefied natural gas (LNG), conversion of natural gas into gas-to-liquids (GTL) fuels and other products. It includes natural gas and liquids exploration and extraction, and the operation of the upstream and midstream infrastructure necessary to deliver these to market. IG also includes the marketing, trading and optimisation of LNG, including LNG as a fuel for heavy-duty vehicles.
($ billion) 22.2 2021: 8.1
($ billion) 16.1 2021: 9.0
($ billion) 27.7 2021: 13.2
(thousand boe/d) 921 2021: 1,004
(million tonnes) 30 2021: 31
(million tonnes) 66 2021: 64
|
|
$ million, except where indicated |
|||||
|---|---|---|---|---|---|---|---|
|
2022 |
2021 |
2020 |
||||
Segment earnings/(loss) |
22,212 |
8,060 |
(7,230) |
||||
Including: |
|
|
|
||||
Revenue (including inter-segment sales) |
73,163 |
37,994 |
25,222 |
||||
Share of profit of joint ventures and associates |
1,219 |
1,933 |
612 |
||||
Interest and other income |
(714) |
1,596 |
212 |
||||
Operating expenses [B] |
5,238 |
4,526 |
5,100 |
||||
Underlying operating expenses [B] |
4,884 |
4,295 |
4,318 |
||||
Exploration |
240 |
122 |
616 |
||||
Depreciation, depletion and amortisation |
2,211 |
5,908 |
19,314 |
||||
Taxation charge/(credit) |
5,899 |
2,648 |
(2,794) |
||||
Identified Items [B] |
6,075 |
(988) |
(11,443) |
||||
Adjusted Earnings [B] |
16,137 |
9,048 |
4,213 |
||||
Adjusted EBITDA [B] |
26,569 |
16,754 |
11,908 |
||||
Capital expenditure |
3,432 |
3,306 |
3,491 |
||||
Cash capital expenditure [B] |
4,265 |
3,502 |
3,566 |
||||
Oil and gas production available for sale (thousand boe/d) |
921 |
1,004 |
1,011 |
||||
LNG liquefaction volumes (million tonnes) |
29.7 |
31.0 |
33.2 |
||||
LNG sales volumes (million tonnes) |
66.0 |
64.2 |
71.9 |
||||
|
|||||||
Business conditions
For the business conditions relevant to Integrated Gas, see “Market overview”.
Production available for sale
In 2022, our production was 336 million barrels of oil equivalent (boe) or 921 thousand boe per day (boe/d), compared with 366 million boe, or 1,004 thousand boe/d in 2021. Natural gas production was 86% of total production in 2022 and 83% of total production in 2021. In 2022, natural gas production decreased by 5% compared with 2021. This was mainly because of the derecognition of Sakhalin-related volumes and production sharing contract effects, partly offset by new field ramp up in Trinidad and Tobago. Liquids production decreased by 25%, driven mainly by derecognition of Sakhalin-related volumes.
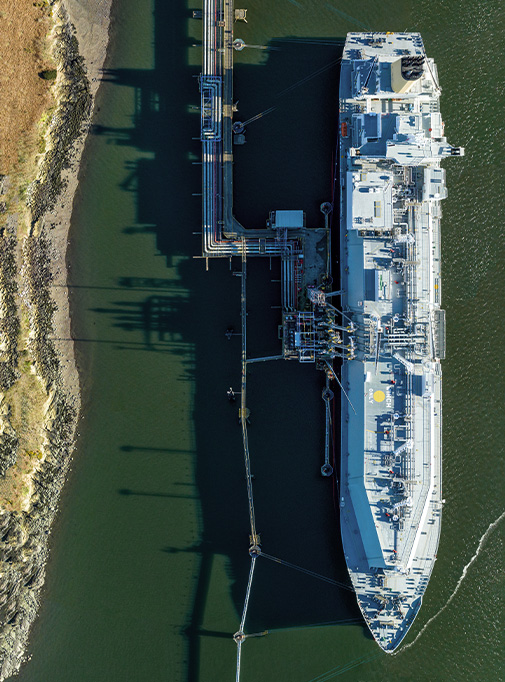
LNG liquefaction volumes
LNG liquefaction volumes were 29.7 million tonnes in 2022 compared with 31.0 million tonnes in 2021. The decrease was mainly a result of the derecognition of Sakhalin-related volumes, and lower feedgas supply, partly offset by lower maintenance.
LNG sales volumes were 66.0 million tonnes in 2022 compared with 64.2 million tonnes in 2021. This increase was mainly a result of higher purchases from third parties and trading and optimisation opportunities.
Through our trading organisation, we market and sell a portion of our share of equity production of LNG together with third-party LNG through our hubs in the UK, UAE and Singapore. Shell has term sales contracts for the majority of our LNG liquefaction and term purchase contracts. We are able to optimise the income we generate from our LNG cargoes through our shipping network, regasification terminals and ability to purchase and deliver LNG spot cargoes from third parties. For example, if one customer does not need a scheduled cargo, we can deliver it to another customer who does need it. Similarly, if a customer needs an additional cargo not available from our production facilities, we contract with third parties to deliver the additional cargo. We conduct paper trades, primarily to manage commodity price risk related to sales and purchase contracts. We also sell LNG for trucks in China, Singapore and Europe.