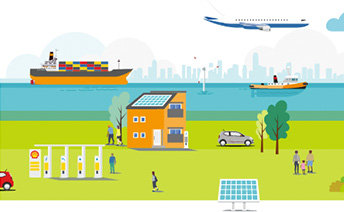


How we create value
We aim to meet the world’s growing need for more and sustainable energy solutions in ways that are economically, environmentally and socially responsible. Our Powering Progress strategy is designed to create value for our shareholders, customers and wider society.
Brand value
Value of Shell brand ($ billion) [F]: 48
2021: 50
How we create value
Energy use
Our inputs [A]
Financial capital
190 ($ billion)
Equity attributable to Shell plc shareholders [B]
2021: 172 ($ billion)
75 ($ billion)
Non-current debt [B]
2021: 81 ($ billion)
45 ($ billion)
Net debt [B][C]
2021: 53 ($ billion)
270 ($ billion)
Average capital employed [B]
2021: 265 ($ billion)
25 ($ billion)
Cash capital expenditure [C]
2021: 20 ($ billion)
Operations
96%
Refining and chemicals availability
2021: 96%
2,864 (kboe/d)
Oil & gas production available for sale
2021: 3,237 (kboe/d)
30 (million tonnes)
LNG liquefaction volumes
2021: 31 (million tonnes)
People
93,000
Number of employees [B][D]
2021: 83,000
266,000
Number of training days
2021: 271,000
Customers, joint arrangements, government relations, suppliers.
>70
Operating countries [B]
2021: >70
1,075 ($ million)
Research and development expenses
2021: 815 ($ million)
10,788
Number of patents [B][E]
2021: 8,532
Natural resources
9,578 (million boe)
Proved oil and gas reserves [B]
2021: 9,365 (million boe)
199 (million MWh)
Energy consumed
2021: 233 (million MWh)
Our outcomes and impacts [A]
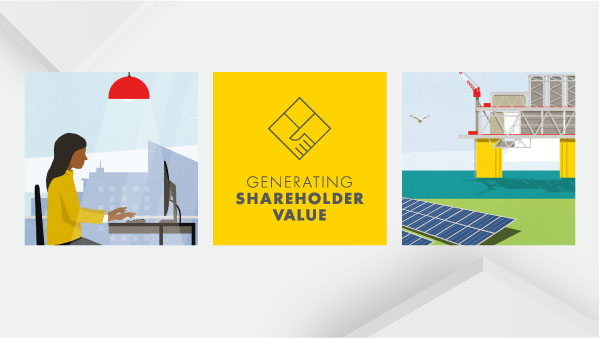
Generating Shareholder Value
68 ($ billion)
Cash flow from operating activities
2021: 45 ($ billion)
40 ($ billion)
Adjusted earnings [C]
2021: 19 ($ billion)
26 ($ billion)
Shareholder distributions [C]
2021: 9 ($ billion)
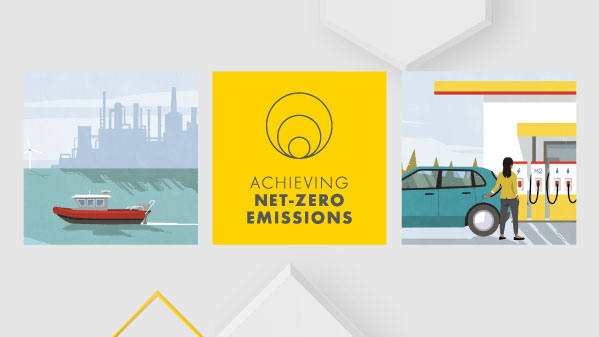
Achieving Net-Zero Emissions
58
Absolute emissions
(Scope 1 and 2 – million tonnes of CO2 equivalent)
2021: 68
2016: 83
76
Net carbon intensity
(Scope 1, 2 and 3 – grams of CO2 equivalent per megajoule)
2021: 77
2016: 79
0.05%
Methane emissions intensity for operated facilities with marketing gas
2021: 0.06%
Powering Lives
30%
Women in senior leadership positions [B]
2021: 30%
68 ($ billion)
Taxes paid and collected
2021: 59 ($ billion)
42 ($ billion)
Total spend on goods and services
2021: 38 ($ billion)
Respecting Nature
18 (million m3)
Fresh water consumed by four major facilities in high water-stressed areas
2021: 22 (million m3)
2018: 25 (million m3)
2 (million tonnes)
Total waste disposed
2021: 2 (million tonnes)
0.06 (thousand tonnes)
Operational spills of more than 100 kilograms
2021: 0.05 (thousand tonnes)
- [A] In 2022 unless stated otherwise.
- [B] At December 31.
- [C] See Non-GAAP measures reconciliations.
- [D] Employee numbers, including comparatives, have been updated from Full Time Equivalents (FTE) to Headcount.
- [E] Includes patents granted and pending patent applications.
- [F] Source: Brand Finance Global 500 (years 2023 and 2022).