| Download XLS |
|
SHELL REALISED PRICES |
YEAR AVERAGE | |||||||||||||
|---|---|---|---|---|---|---|---|---|---|---|---|---|---|---|
|
|
2012 |
2011 |
2010 |
2009 |
2008 | |||||||||
|
|
SUBS |
EAI |
SUBS |
EAI |
SUBS |
EAI |
SUBS |
EAI |
SUBS |
EAI | ||||
| ||||||||||||||
|
Oil and natural gas liquids ($/b) |
|
|
|
|
|
|
|
| ||||||
|
Europe |
108.13 |
104.60 |
106.77 |
103.97 |
73.35 |
83.24 |
55.53 |
56.97 |
89.28 |
86.33 | ||||
|
Asia |
107.76 |
67.33 |
103.73 |
62.81 |
76.21 |
44.27 |
57.50 |
36.53 |
95.92 |
49.78 | ||||
|
Oceania |
91.62 |
90.14[A] |
92.38 |
99.74[A] |
67.90 |
78.05[A] |
50.47 |
56.16[A] |
85.92 |
99.99[A] | ||||
|
Africa |
112.45 |
|
111.70 |
|
79.63 |
|
61.45 |
|
98.52 |
| ||||
|
North America – |
103.59 |
110.00 |
104.93 |
109.49 |
76.36 |
74.27 |
57.25 |
56.24 |
97.95 |
89.74 | ||||
|
North America – |
68.31 |
|
70.72 |
|
53.23 |
|
39.26 |
|
67.07[B] |
| ||||
|
South America |
100.01 |
97.33 |
100.44 |
97.76 |
69.99 |
63.57 |
57.76 |
58.00 |
79.42 |
82.25 | ||||
|
Total |
107.15 |
76.01 |
105.74 |
73.01 |
75.74 |
52.42 |
57.39 |
42.49 |
92.75 |
63.59 | ||||
|
Natural gas ($/thousand scf) |
|
|
|
|
|
|
|
| ||||||
|
Europe |
9.48 |
9.64 |
9.40 |
8.58 |
6.87 |
6.71 |
7.06 |
8.17 |
9.46 |
10.87 | ||||
|
Asia |
4.81 |
10.13 |
4.83 |
8.37 |
4.40 |
6.55 |
3.61 |
4.26 |
4.67 |
7.06 | ||||
|
Oceania |
11.14 |
9.48[A] |
9.95 |
10.09 |
8.59 |
8.79[A] |
5.29 |
3.94[A] |
2.96 |
4.13[A] | ||||
|
Africa |
2.74 |
|
2.32 |
|
1.96 |
|
1.71 |
|
1.67 |
| ||||
|
North America – |
3.17 |
7.88 |
4.54 |
8.91 |
4.90 |
7.27 |
4.36 |
5.02 |
9.61 |
12.15 | ||||
|
North America – |
2.36 |
|
3.64 |
|
4.09 |
|
3.73 |
|
7.71 |
| ||||
|
South America |
2.63 |
1.04 |
2.81 |
0.99 |
3.79 |
|
3.18 |
|
4.37 |
| ||||
|
Total |
5.53 |
9.81 |
5.92 |
8.58 |
5.28 |
6.81 |
4.83 |
6.73 |
6.85 |
9.63 | ||||
|
Other ($/b) |
|
|
|
|
|
|
|
|
|
| ||||
|
North America – |
68.97 |
|
76.28 |
|
66.00 |
|
50.00 |
|
|
| ||||
|
North America – |
81.46 |
|
91.32 |
|
71.56 |
|
56.23 |
|
|
| ||||
|
North America – |
|
|
|
|
|
|
|
|
88.98 |
| ||||
OIL AND GAS MARKER INDUSTRY PRICES$/b $/MMBtu
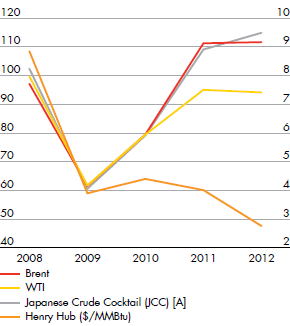
- [A]
- Based on available market information at the end of the year.
CHEMICAL MARGINS$/tonne
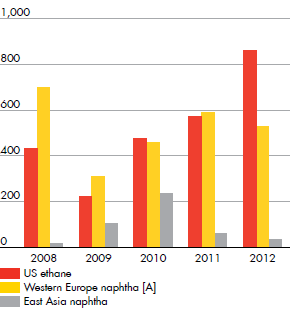
- [A]
- Based on available market information at the end of the year.
REFINING MARKER INDUSTRY
GROSS MARGINS$/b
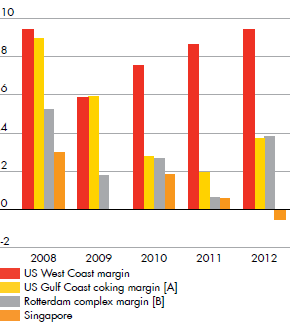
- [A]
- US Gulf Coast margin up to and including 2009.
- [B]
- Rotterdam Brent up to and including 2009.
