| Download XLS |
|
SUMMARY OF RESULTS |
$ MILLION | ||||
|---|---|---|---|---|---|
|
|
2012 |
2011 |
2010 |
2009 |
2008 |
|
Upstream |
22,162 |
24,455 |
15,935 |
8,354 |
26,506 |
|
Downstream (current cost of supplies |
5,350 |
4,289 |
2,950 |
258 |
5,309 |
|
Corporate and non-controlling interest |
(468) |
(119) |
(242) |
1,192 |
(449) |
|
CCS earnings |
27,044 |
28,625 |
18,643 |
9,804 |
31,366 |
|
Estimated CCS adjustment |
(452) |
2,293 |
1,484 |
2,714 |
(5,089) |
|
Income attributable to shareholders |
26,592 |
30,918 |
20,127 |
12,518 |
26,277 |
|
Identified items |
1,905 |
3,938 |
570 |
(1,749) |
2,956 |
|
CCS earnings excluding identified items |
25,139 |
24,687 |
18,073 |
11,553 |
28,410 |
|
Basic CCS earnings per share ($) |
4.32 |
4.61 |
3.04 |
1.60 |
5.09 |
|
Estimated CCS adjustment per share ($) |
(0.07) |
0.37 |
0.24 |
0.44 |
(0.82) |
|
Basic earnings per €0.07 |
4.25 |
4.98 |
3.28 |
2.04 |
4.27 |
|
Basic earnings per ADS ($) |
8.50 |
9.96 |
6.56 |
4.08 |
8.54 |
|
Net cash from operating activities |
46,140 |
36,771 |
27,350 |
21,488 |
43,918 |
|
Cash flow from operating activities |
7.37 |
5.92 |
4.46 |
3.51 |
7.13 |
|
Dividend per share ($) |
1.72 |
1.68 |
1.68 |
1.68 |
1.60 |
|
Dividend per ADS ($) |
3.44 |
3.36 |
3.36 |
3.36 |
3.20 |
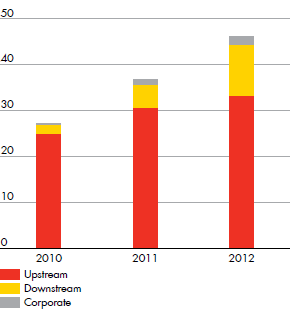
CCS EARNINGS$ billion
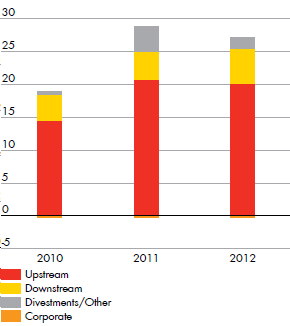
NET CASH FROM OPERATING ACTIVITIES$ billion