

| Download XLS |
|
KEY STATISTICS | |||||||||
|---|---|---|---|---|---|---|---|---|---|
|
|
2014 |
2013 |
2012 |
2011 |
2010 | ||||
|
|||||||||
|
Downstream CCS earnings ($ million) |
|
|
|
|
|
||||
|
Oil products |
1,994 |
2,026 |
4,008 |
2,136 |
1,439 |
||||
|
Chemicals |
1,417 |
1,843 |
1,374 |
2,034 |
1,511 |
||||
|
Total Downstream earnings ($ million) |
3,411 |
3,869 |
5,382 |
4,170 |
2,950 |
||||
|
Total Downstream earnings excluding identified items ($ million) |
6,265 |
4,466 |
5,343 |
4,155 |
3,873 |
||||
|
Downstream cash flow from operations ($ million) |
11,292 |
7,903 |
11,111 |
4,921 |
1,961 |
||||
|
Oil products sales volumes (thousand b/d) |
6,365 |
6,164 |
6,235 |
6,196 |
6,460 |
||||
|
Chemicals sales volumes (thousand tonnes) |
17,008 |
17,386 |
18,669 |
18,831 |
20,653 |
||||
|
Refinery processing intake (thousand b/d) |
2,903 |
2,915 |
2,819 |
2,845 |
3,197 |
||||
|
Refinery availability (%) |
94 |
92 |
93 |
92 |
92 |
||||
|
Chemical plant availability (%) [A] |
85 |
92 |
91 |
89 |
92 |
||||
|
Downstream capital investment ($ million) [B] |
5,910 |
5,528 |
5,454 |
7,548 |
4,759 |
||||
|
Downstream capital employed ($ million) |
48,925 |
64,507 |
62,426 |
64,237 |
61,789 |
||||
|
Downstream employees (thousands) |
47 |
48 |
48 |
51 |
59 |
||||
Downstream CCS earnings and net cash from operating activities [A] $ billion
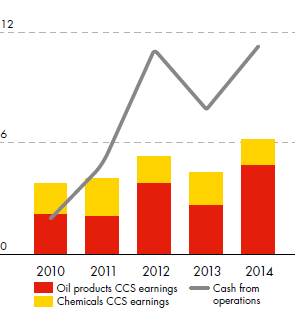
- [A]
- CCS earnings excluding identified items.
Global brand preference %
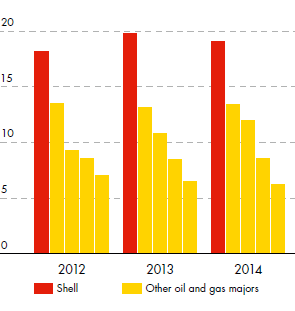
Source: Ipsos market research – Shell customer tracker survey program (33 markets covered 2012 to 2014).
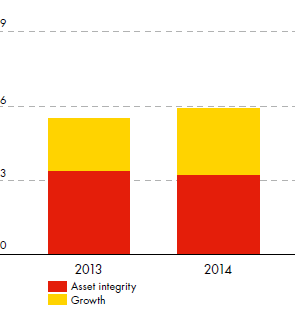
Downstream capital investment $ billion