 Our businesses and organisation
 Overall highlights in 2019
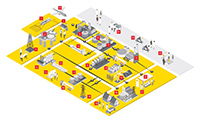
 Projects & Technology overview
 Financial data
Oil sales and retail sites
|
2019 |
2018 |
2017 |
2016 |
2015 |
||||||||
|---|---|---|---|---|---|---|---|---|---|---|---|---|---|
Europe |
|
|
|
|
|
||||||||
Gasolines |
334 |
323 |
317 |
309 |
403 |
||||||||
Kerosines |
317 |
294 |
272 |
258 |
251 |
||||||||
Gas/Diesel oils |
720 |
745 |
758 |
765 |
779 |
||||||||
Fuel oil |
138 |
178 |
170 |
183 |
186 |
||||||||
Other products |
278 |
314 |
362 |
287 |
240 |
||||||||
Total |
1,787 |
1,854 |
1,879 |
1,802 |
1,859 |
||||||||
Asia |
|
|
|
|
|
||||||||
Gasolines |
408 |
373 |
399 |
388 |
379 |
||||||||
Kerosines |
208 |
210 |
216 |
195 |
214 |
||||||||
Gas/Diesel oils |
535 |
543 |
516 |
519 |
533 |
||||||||
Fuel oil |
330 |
407 |
349 |
354 |
340 |
||||||||
Other products |
518 |
620 |
536 |
593 |
489 |
||||||||
Total |
2,000 |
2,153 |
2,017 |
2,049 |
1,955 |
||||||||
Oceania |
|
|
|
|
|
||||||||
Gasolines |
– |
– |
– |
– |
– |
||||||||
Kerosines |
– |
– |
23 |
55 |
51 |
||||||||
Gas/Diesel oils |
– |
– |
– |
– |
– |
||||||||
Fuel oil |
– |
– |
– |
– |
– |
||||||||
Other products |
– |
– |
– |
– |
– |
||||||||
Total |
– |
– |
23 |
55 |
51 |
||||||||
Africa |
|
|
|
|
|
||||||||
Gasolines |
46 |
42 |
43 |
41 |
37 |
||||||||
Kerosines |
13 |
10 |
13 |
10 |
9 |
||||||||
Gas/Diesel oils |
70 |
74 |
78 |
66 |
57 |
||||||||
Fuel oil |
2 |
2 |
2 |
1 |
1 |
||||||||
Other products |
6 |
6 |
6 |
7 |
15 |
||||||||
Total |
137 |
134 |
142 |
125 |
119 |
||||||||
Americas |
|
|
|
|
|
||||||||
Gasolines |
1,419 |
1,446 |
1,415 |
1,331 |
1,325 |
||||||||
Kerosines |
239 |
236 |
212 |
205 |
204 |
||||||||
Gas/Diesel oils |
582 |
567 |
545 |
540 |
584 |
||||||||
Fuel oil |
120 |
117 |
92 |
69 |
86 |
||||||||
Other products |
277 |
276 |
275 |
307 |
249 |
||||||||
Total |
2,637 |
2,642 |
2,539 |
2,452 |
2,448 |
||||||||
Total product sales [C][D] |
|
|
|
|
|
||||||||
Gasolines |
2,207 |
2,184 |
2,174 |
2,069 |
2,144 |
||||||||
Kerosines |
777 |
750 |
736 |
723 |
729 |
||||||||
Gas/Diesel oils |
1,907 |
1,929 |
1,897 |
1,890 |
1,953 |
||||||||
Fuel oil |
590 |
704 |
613 |
607 |
613 |
||||||||
Other products |
1,079 |
1,216 |
1,179 |
1,194 |
993 |
||||||||
Total |
6,561 |
6,783 |
6,599 |
6,483 |
6,432 |
||||||||
|
|||||||||||||
|
2019 |
2018 |
2017 |
2016 |
2015 |
|---|---|---|---|---|---|
Gasolines |
33.6 |
32.2 |
32.9 |
31.9 |
33.3 |
Kerosines |
11.8 |
11.1 |
11.2 |
11.2 |
11.3 |
Gas/Diesel oils |
29.1 |
28.4 |
28.7 |
29.2 |
30.4 |
Fuel oil |
9.0 |
10.4 |
9.3 |
9.4 |
9.5 |
Other products |
16.5 |
17.9 |
17.9 |
18.4 |
15.5 |
Total |
100.0 |
100.0 |
100.0 |
100.0 |
100.0 |
|
2019 |
2018 |
2017 |
2016 |
2015 |
||||
|---|---|---|---|---|---|---|---|---|---|
Europe |
7,978 |
7,888 |
7,776 |
7,768 |
7,829 |
||||
Asia [B] |
10,138 |
9,754 |
9,499 |
9,496 |
9,286 |
||||
Oceania [B] |
1,038 |
1,030 |
980 |
950 |
950 |
||||
Africa |
2,494 |
2,502 |
2,419 |
2,277 |
2,262 |
||||
Americas |
23,021 |
23,223 |
23,349 |
22,855 |
22,385 |
||||
Total |
44,669 |
44,397 |
44,023 |
43,346 |
42,712 |
||||
|
|||||||||