 Our businesses and organisation
 Overall highlights in 2019
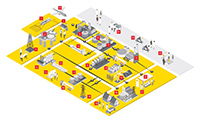
 Projects & Technology overview
 Financial data
Financial statements information
IFRS 16 Leases was adopted with effect from January 1, 2019. IFRS 16 Leases primarily impacts the following key measures of Shell’s financial performance: Segment earnings; Cash flow from operating activities; Cash flow from operating activities excluding working capital movements; Free cash flow; Capital investment and Cash capital expenditure; Operating expenses; Gearing; and Return on average capital employed.
In accordance with Shell’s use of the modified retrospective transition method, comparative information for prior years is not restated, and continues to be presented as reported under IAS 17.
|
2019 |
2018 |
2017 |
2016 |
2015 |
|---|---|---|---|---|---|
Revenue |
344,877 |
388,379 |
305,179 |
233,591 |
264,960 |
Share of profit of joint ventures and associates |
3,604 |
4,106 |
4,225 |
3,545 |
3,527 |
Interest and other income |
3,625 |
4,071 |
2,466 |
2,897 |
3,669 |
Total revenue and other income |
352,106 |
396,556 |
311,870 |
240,033 |
272,156 |
Purchases |
252,983 |
294,399 |
223,447 |
162,574 |
194,644 |
Production and manufacturing expenses |
26,438 |
26,970 |
26,652 |
28,434 |
28,095 |
Selling, distribution and administrative expenses |
10,493 |
11,360 |
10,509 |
12,101 |
11,956 |
Research and development |
962 |
986 |
922 |
1,014 |
1,093 |
Exploration |
2,354 |
1,340 |
1,945 |
2,108 |
5,719 |
Depreciation, depletion and amortisation |
28,701 |
22,135 |
26,223 |
24,993 |
26,714 |
Interest expense |
4,690 |
3,745 |
4,042 |
3,203 |
1,888 |
Total expenditure |
326,621 |
360,935 |
293,740 |
234,427 |
270,109 |
Income before taxation |
25,485 |
35,621 |
18,130 |
5,606 |
2,047 |
Taxation charge/(credit) |
9,053 |
11,715 |
4,695 |
829 |
(153) |
Income for the period |
16,432 |
23,906 |
13,435 |
4,777 |
2,200 |
Income attributable to non-controlling interest |
590 |
554 |
458 |
202 |
261 |
Income attributable to Royal Dutch Shell plc shareholders |
15,842 |
23,352 |
12,977 |
4,575 |
1,939 |
|
2019 |
2018 |
2017 |
2016 |
2015 |
|---|---|---|---|---|---|
Earnings on a current cost of supplies basis (CCS earnings) |
15,827 |
24,364 |
12,471 |
3,692 |
4,155 |
Attributable to non-controlling interest |
(557) |
(531) |
(390) |
(159) |
(313) |
Earnings on a current cost of supplies basis attributable to Royal Dutch Shell plc shareholders |
15,270 |
23,833 |
12,081 |
3,533 |
3,842 |
Current cost of supplies adjustment |
605 |
(458) |
964 |
1,085 |
(1,955) |
Non-controlling interest |
(33) |
(23) |
(68) |
(43) |
52 |
Income attributable to Royal Dutch Shell plc shareholders |
15,842 |
23,352 |
12,977 |
4,575 |
1,939 |
Non-controlling interest |
590 |
554 |
458 |
202 |
261 |
Income for the period |
16,432 |
23,906 |
13,435 |
4,777 |
2,200 |
Segment earnings are presented on a current cost of supplies basis (CCS earnings), which is the earnings measure used by the Chief Executive Officer for the purposes of making decisions about allocating resources and assessing performance. On this basis, the purchase price of volumes sold during the period is based on the current cost of supplies during the same period after making allowance for the tax effect. CCS earnings therefore exclude the effect of changes in the oil price on inventory carrying amounts. Sales between segments are based on prices generally equivalent to commercially available prices. CCS earnings is a non-GAAP measure.
|
2019 |
2018 |
2017 |
2016 |
2015 |
|---|---|---|---|---|---|
Basic earnings per share |
1.97 |
2.82 |
1.58 |
0.58 |
0.31 |
Diluted earnings per share |
1.95 |
2.80 |
1.56 |
0.58 |
0.30 |
|
2019 |
2018 |
2017 |
2016 |
2015 |
|---|---|---|---|---|---|
Basic weighted average number of A and B shares |
8,058.3 |
8,282.8 |
8,223.4 |
7,833.7 |
6,320.3 |
Diluted weighted average number of A and B shares |
8,112.5 |
8,348.7 |
8,299.0 |
7,891.7 |
6,393.8 |
Shares outstanding at the end of the period |
7,847.1 |
8,179.0 |
8,312.8 |
8,145.3 |
6,397.5 |
|
2019 |
2018 |
2017 |
2016 |
2015 |
|---|---|---|---|---|---|
Current tax |
7,596 |
10,475 |
6,591 |
2,731 |
7,058 |
Deferred tax |
1,457 |
1,240 |
(1,896) |
(1,902) |
(7,211) |
Total taxation charge/(credit) |
9,053 |
11,715 |
4,695 |
829 |
(153) |
As a % of income before taxation |
36 |
33 |
26 |
15 |
(7) |
|
2019 |
2018 |
2017 |
2016 |
2015 |
|---|---|---|---|---|---|
Assets |
|
|
|
|
|
Non-current assets |
|
|
|
|
|
Intangible assets |
23,486 |
23,586 |
24,180 |
23,967 |
6,283 |
Property, plant and equipment |
238,349 |
223,175 |
226,380 |
236,098 |
182,838 |
Joint ventures and associates |
22,808 |
25,329 |
27,927 |
33,255 |
30,150 |
Investments in securities |
2,989 |
3,074 |
7,222 |
5,952 |
3,416 |
Deferred tax |
10,524 |
12,097 |
13,791 |
14,425 |
11,033 |
Retirement benefits |
4,717 |
6,051 |
2,799 |
1,456 |
4,362 |
Trade and other receivables |
8,085 |
7,826 |
8,475 |
9,148 |
7,973 |
Derivative financial instruments |
689 |
574 |
919 |
405 |
744 |
|
311,647 |
301,712 |
311,693 |
324,706 |
246,799 |
Current assets |
|
|
|
|
|
Inventories |
24,071 |
21,117 |
25,223 |
21,775 |
15,822 |
Trade and other receivables |
43,414 |
42,431 |
44,565 |
39,707 |
32,670 |
Derivative financial instruments |
7,149 |
7,193 |
5,304 |
5,957 |
13,114 |
Cash and cash equivalents |
18,055 |
26,741 |
20,312 |
19,130 |
31,752 |
|
92,689 |
97,482 |
95,404 |
86,569 |
93,358 |
Total assets |
404,336 |
399,194 |
407,097 |
411,275 |
340,157 |
Liabilities |
|
|
|
|
|
Non-current liabilities |
|
|
|
|
|
Debt |
81,360 |
66,690 |
73,870 |
82,992 |
52,849 |
Trade and other payables |
2,342 |
2,735 |
3,447 |
3,610 |
2,841 |
Derivative financial instruments |
1,209 |
1,399 |
981 |
3,315 |
1,687 |
Deferred tax |
14,522 |
14,837 |
13,007 |
15,274 |
8,976 |
Retirement benefits |
13,017 |
11,653 |
13,247 |
14,130 |
12,587 |
Decommissioning and other provisions |
21,799 |
21,533 |
24,966 |
29,618 |
26,148 |
|
134,249 |
118,847 |
129,518 |
148,939 |
105,088 |
Current liabilities |
|
|
|
|
|
Debt |
15,064 |
10,134 |
11,795 |
9,484 |
5,530 |
Trade and other payables |
49,208 |
48,888 |
51,410 |
46,999 |
42,013 |
Derivative financial instruments |
5,429 |
7,184 |
5,253 |
6,418 |
10,757 |
Taxes payable |
6,693 |
7,497 |
7,250 |
6,685 |
8,233 |
Retirement benefits |
419 |
451 |
594 |
455 |
350 |
Decommissioning and other provisions |
2,811 |
3,659 |
3,465 |
3,784 |
4,065 |
|
79,624 |
77,813 |
79,767 |
73,825 |
70,948 |
Total liabilities |
213,873 |
196,660 |
209,285 |
222,764 |
176,036 |
Equity |
|
|
|
|
|
Share capital |
657 |
685 |
696 |
683 |
546 |
Shares held in trust |
(1,063) |
(1,260) |
(917) |
(901) |
(584) |
Other reserves |
14,451 |
16,615 |
16,932 |
11,298 |
(17,186) |
Retained earnings |
172,431 |
182,606 |
177,645 |
175,566 |
180,100 |
Equity attributable to Royal Dutch Shell plc shareholders |
186,476 |
198,646 |
194,356 |
186,646 |
162,876 |
Non-controlling interest |
3,987 |
3,888 |
3,456 |
1,865 |
1,245 |
Total equity |
190,463 |
202,534 |
197,812 |
188,511 |
164,121 |
Total liabilities and equity |
404,336 |
399,194 |
407,097 |
411,275 |
340,157 |
|
2019 |
2018 |
2017 |
2016 |
2015 |
||||
|---|---|---|---|---|---|---|---|---|---|
Income before taxation for the period [A] |
25,485 |
35,621 |
18,130 |
5,606 |
2,047 |
||||
Adjustment for: |
|
|
|
|
|
||||
Interest expense (net) |
3,705 |
2,878 |
3,365 |
2,752 |
1,529 |
||||
Depreciation, depletion and amortisation |
28,701 |
22,135 |
26,223 |
24,993 |
26,714 |
||||
Exploration well write-offs |
1,218 |
449 |
897 |
834 |
2,773 |
||||
Net gains on sale and revaluation of non-current assets and businesses |
(2,519) |
(3,265) |
(1,640) |
(2,141) |
(3,460) |
||||
Share of profit of joint ventures and associates |
(3,604) |
(4,106) |
(4,225) |
(3,545) |
(3,527) |
||||
Dividends received from joint ventures and associates |
4,139 |
4,903 |
4,998 |
3,820 |
4,627 |
||||
(Increase)/decrease in inventories |
(2,635) |
2,823 |
(2,079) |
(5,658) |
2,827 |
||||
(Increase)/decrease in current receivables |
(921) |
1,955 |
(2,577) |
(4,127) |
9,446 |
||||
(Decrease)/increase in current payables |
(1,223) |
(1,336) |
2,406 |
1,359 |
(7,538) |
||||
Derivative financial instruments |
(1,484) |
799 |
(1,039) |
1,461 |
1,244 |
||||
Retirement benefits [A] |
(365) |
390 |
(654) |
127 |
1,024 |
||||
Decommissioning and other provisions [A] |
(686) |
(1,754) |
(1,706) |
(649) |
(587) |
||||
Other [A] |
(28) |
1,264 |
(142) |
217 |
365 |
||||
Tax paid |
(7,605) |
(9,671) |
(6,307) |
(4,434) |
(7,673) |
||||
Cash flow from operating activities |
42,178 |
53,085 |
35,650 |
20,615 |
29,810 |
||||
Capital expenditure |
(22,971) |
(23,011) |
(20,845) |
(22,116) |
(26,131) |
||||
Acquisition of BG Group plc, net of cash and cash equivalents acquired |
– |
– |
– |
(11,421) |
– |
||||
Investments in joint ventures and associates |
(743) |
(880) |
(595) |
(1,330) |
(896) |
||||
Investments in equity securities [A] |
(205) |
(187) |
(93) |
(132) |
(94) |
||||
Proceeds from sale of property, plant and equipment and businesses |
4,803 |
4,366 |
8,808 |
2,072 |
4,720 |
||||
Proceeds from sale of joint ventures and associates |
2,599 |
1,594 |
2,177 |
1,565 |
276 |
||||
Proceeds from sale of equity securities [A] |
469 |
4,505 |
2,636 |
3 |
81 |
||||
Interest received |
911 |
823 |
724 |
470 |
288 |
||||
Other investing cash inflows [A] |
2,921 |
1,373 |
2,909 |
1,744 |
2,552 |
||||
Other investing cash outflows [A] |
(3,563) |
(2,242) |
(3,750) |
(1,818) |
(3,203) |
||||
Cash flow from investing activities |
(15,779) |
(13,659) |
(8,029) |
(30,963) |
(22,407) |
||||
Net decrease in debt with maturity period within three months |
(308) |
(396) |
(869) |
(360) |
(586) |
||||
Other debt: |
|
|
|
|
|
||||
New borrowings |
11,185 |
3,977 |
760 |
18,144 |
21,500 |
||||
Repayments |
(14,292) |
(11,912) |
(11,720) |
(6,710) |
(6,023) |
||||
Interest paid |
(4,649) |
(3,574) |
(3,550) |
(2,938) |
(1,742) |
||||
Derivative financial instruments [B] |
(48) |
|
|
|
|
||||
Change in non-controlling interest |
– |
678 |
293 |
1,110 |
598 |
||||
Cash dividends paid to: |
|
|
|
|
|
||||
Royal Dutch Shell plc shareholders |
(15,198) |
(15,675) |
(10,877) |
(9,677) |
(9,370) |
||||
Non-controlling interest |
(537) |
(584) |
(406) |
(180) |
(117) |
||||
Repurchases of shares |
(10,188) |
(3,947) |
– |
– |
(409) |
||||
Shares held in trust: net purchases and dividends received |
(1,174) |
(1,115) |
(717) |
(160) |
(39) |
||||
Cash flow from financing activities |
(35,209) |
(32,548) |
(27,086) |
(771) |
3,812 |
||||
Currency translation differences relating to cash and cash equivalents |
124 |
(449) |
647 |
(1,503) |
(1,070) |
||||
Increase/(decrease) in cash and cash equivalents |
(8,686) |
6,429 |
1,182 |
(12,622) |
10,145 |
||||
Cash and cash equivalents at beginning of year |
26,741 |
20,312 |
19,130 |
31,752 |
21,607 |
||||
Cash and cash equivalents at end of year |
18,055 |
26,741 |
20,312 |
19,130 |
31,752 |
||||
|
|||||||||
|
2019 |
2018 |
2017 |
2016 |
2015 |
||||||
|---|---|---|---|---|---|---|---|---|---|---|---|
Cash flow from operating activities |
42,178 |
53,085 |
35,650 |
20,615 |
29,810 |
||||||
Cash flow from investing activities |
(15,779) |
(13,659) |
(8,029) |
(30,963) |
(22,407) |
||||||
Free cash flow |
26,399 |
39,426 |
27,621 |
(10,348) |
7,403 |
||||||
Less: Cash inflows related to divestments [A] |
7,871 |
10,465 |
13,619 |
3,641 |
5,077 |
||||||
Add: Tax paid on divestments |
187 |
482 |
[C] |
[C] |
[C] |
||||||
Add: Cash outflows related to inorganic capital expenditure [B] |
1,400 |
1,740 |
1,138 |
11,481 |
110 |
||||||
Organic free cash flow |
20,116 |
31,183 |
15,140 |
(2,507) |
2,436 |
||||||
|
|||||||||||
Free cash flow is a non-GAAP measure used to evaluate cash available for financing activities, including dividend payments and debt servicing, after investment in maintaining and growing the business. It is defined as the sum of “Cash flow from operating activities” and “Cash flow from investing activities”.
Cash flows from acquisition and divestment activities are removed from Free cash flow to arrive at the Organic free cash flow, a measure used by management to evaluate the generation of free cash flow without these activities.