 Our businesses and organisation
 Overall highlights in 2019
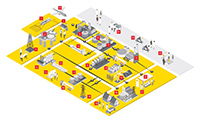
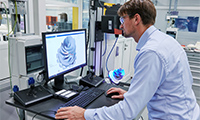 Projects & Technology overview
 Financial data
Integrated Gas overview
Key milestones
Portfolio and business development
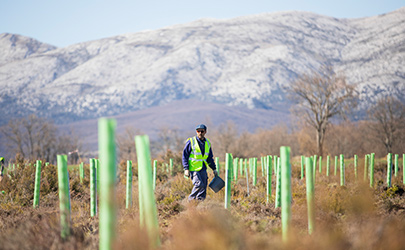
- In December 2018, we formed two joint ventures: with EDF Renewables to build wind farms off the New Jersey coast; and with EDP Renewables (EDPR) to build wind farms off Massachusetts, in the USA. Leases were granted by the authorities for JV with EDF in December 2018 and with EDPR in February 2019. In November, Massachusetts state authorities selected our JV with EDPR (Shell interest 50%) to develop and supply 804 MW of clean, renewable energy from offshore wind to the electricity customers in the state;
- In February, we acquired sonnen, a provider of smart energy storage systems; and
- In November, we acquired ERM Power, one of Australia’s leading commercial and industrial electricity retailers.
Major milestones
- In June, the first shipment of LNG sailed from our Prelude FLNG facility (Shell interest 67.5%);
- In September, the first of 10 Moveable Modular Liquefaction System (MMLS) units started up at Elba Island in Savannah, Georgia, USA; and
- In November, FID was taken for the Barracuda Project (Shell interest 100%), a subsea tie-back of two gas wells to an existing platform on the East Coast of Trinidad.
Divestments
- In Timor-Leste (East Timor), we sold our 26.6% interest in the undeveloped Sunrise gas field to the Timor-Leste government; and
- In India, we sold our 10% interest in Mahanagar Gas Limited.
|
|
2019 |
2018 |
2017 |
2016 |
2015 |
||||||||
|---|---|---|---|---|---|---|---|---|---|---|---|---|---|
|
Earnings ($ million) |
8,628 |
11,444 |
5,078 |
2,529 |
3,170 |
||||||||
|
Earnings excluding identified items ($ million) |
8,955 |
9,399 |
5,268 |
3,700 |
5,057 |
||||||||
|
Cash flow from operating activities ($ million) |
15,311 |
14,617 |
6,467 |
9,132 |
7,728 |
||||||||
|
Liquids production (thousand b/d) [A] |
156 |
214 |
203 |
223 |
204 |
||||||||
|
Natural gas production (million scf/d) [A] |
4,442 |
4,311 |
3,969 |
3,832 |
2,469 |
||||||||
|
Total production (thousand boe/d) [A][B] |
922 |
957 |
887 |
884 |
631 |
||||||||
|
LNG liquefaction volumes (million tonnes) |
35.6 |
34.3 |
33.2 |
30.9 |
22.6 |
||||||||
|
LNG sales volumes (million tonnes) |
74.5 |
71.2 |
66.0 |
57.1 |
39.2 |
||||||||
|
Cash capital expenditure ($ million) |
4,299 |
3,819 |
3,616 |
4,105 |
4,777 |
||||||||
|
Capital employed ($ million) |
90,824 |
86,850 |
87,462 |
86,631 |
62,481 |
||||||||
|
Employees (thousands) |
10[C] |
9[C][D] |
8[C][D] |
9[C] |
13 |
||||||||
|
|||||||||||||
Integrated Gas earnings and cash flow [A]
$ billion

[A] Earnings excluding identified items
Integrated Gas production
mboe/d
mtpa