Environmental performance
We improved or maintained our environmental performance across most areas during 2015. This was due to operational improvements as well as reduced activity and divestments. Details about our environmental performance are provided below and under Managing methane emissions and Flaring for methane and flaring.
Spills
The number of operational oil spills in 2015 was 108, down from 153 in 2014. The volume of operational spills of oil and oil products increased to 0.8 thousand tonnes, from 0.7 thousand tonnes in 2014.
The number of spills caused by sabotage and theft fell to 94 from 139 in 2014. The volume of these spills decreased to 2.2 thousand tonnes in 2015 from 2.7 thousand tonnes in 2014. In 2015, sabotage and oil theft remained a significant cause of spills in the Niger Delta, Nigeria. See Spill prevention and response for more information on spills in Nigeria.
The reduction in spills was in part due to divestments. We investigate and learn from all spills to improve our performance and we clean up the areas near our operations that are affected by spills, irrespective of the cause. As of the end of March 2016, there were two spills under investigation in Nigeria that may result in adjustments.
Spills – Operational [A]
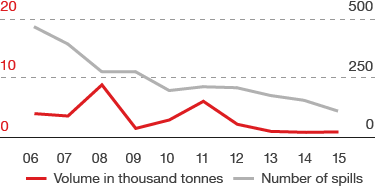
[A] Over 100 kilograms.
Spills – Sabotage [A]
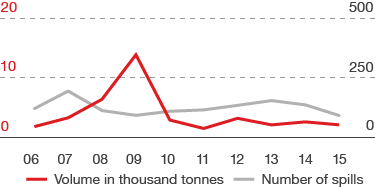
[A] Sabotage and theft-related spills over 100 kilograms.
Water use
Fresh water withdrawn
million cubic metres
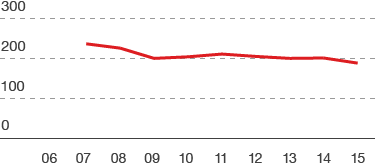
Our facilities are designed and run to help minimise their use of fresh water, particularly in areas of water scarcity. In 2015, the amount of fresh water we used decreased to 186 million cubic metres from 199 million cubic metres in 2014. More than three-quarters of our fresh water use was for manufacturing oil products and chemicals. Our Upstream operations accounted for almost a quarter of our total fresh water use.
Energy efficiency
One of the ways we can manage our direct GHG emissions is to work on improving the energy efficiency of the facilities we operate. The main metric that we use to measure our energy efficiency is energy intensity (the amount of energy consumed for every unit of output).
In 2015, the overall energy intensity for the production of oil and gas in our Upstream business (excluding oil sands and gas-to-liquids) improved slightly compared with 2014. This was partly due to divestments of unconventional assets in the USA and Canada.
All our major upstream facilities have energy-management plans in place to make the best use of those facilities, including the use of improved field management techniques. We expect it will be more difficult in future to maintain the energy-efficiency levels of recent years, as existing fields age and new production comes from more energy-intensive sources. This may increase our upstream energy intensity over time.
In our oil sands operations, energy intensity improved from 6.3 gigajoules for every tonne of production in 2014 to 5.8 gigajoules in 2015. The overall energy intensity for the manufacture of oil products at our refineries worsened, from 94.9 refinery energy index in 2014 to 95.4 in 2015. This was mainly due to more unplanned production shutdowns at several refineries.
The methodology for calculating the energy intensity of our chemical plants was updated in 2015; therefore data for preceding years is not directly comparable and have not been recalculated. Based on the new methodology, the comparable result for 2014 was 90.7, compared with 90.4 which was originally calculated. The increase to 91.6 in 2015 was mainly due to unplanned equipment shutdowns at our chemical plant in Moerdijk. (To read more about our energy efficiency, see Mitigating climate change).
Energy intensity – Refineries
refinery energy index [A]
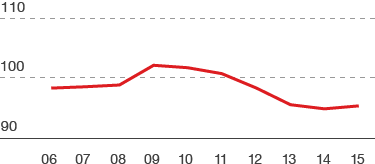
[A] Indexed to 2002; based on 2006 Solomon EIITM methodology
Energy intensity – Upstream
(excluding Oil Sands and GTL)
gigajoules/tonne production [A]
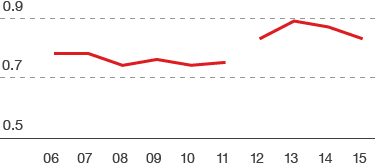
[A] 2012-2015 data are reported in accordance with IPIECA/API/IOGP guidance 2010
Energy intensity – Chemical plants
chemicals energy index [A]
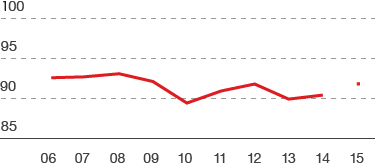
[A] CEI calculation methodology changed in 2015; therefore, data for prior years are not directly comparable.
Energy intensity – Oil Sands
gigajoules/tonne production [A]
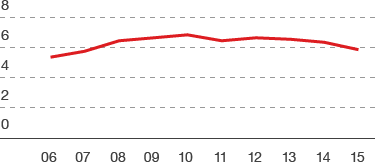
[A] Includes mining and upgrading operations.
Air emissions
We track emissions released into the atmosphere from all our operations. Our sulphur oxides emissions decreased from 97 thousand tonnes in 2014 to 88 thousand tonnes in 2015. This decrease was partly due to using fuel with lower sulphur content in our shipping activities but was partly offset by the higher sulphur content of the crude oil processed by our refineries.
Our nitrogen oxides emissions decreased from 146 thousand tonnes in 2014 to 104 thousand tonnes in 2015. The realignment of reporting boundaries in 2015 to follow guidance from IPIECA/API/IOGP, in part affected these numbers.
Our emissions of volatile organic compounds (VOCs) decreased to 125 thousand tonnes in 2015 compared with 151 thousand tonnes in 2014. This was mostly due to a reduction of venting in Majnoon, Iraq. We expect our VOC emissions to further decrease in the coming years as a result of our efforts to reduce flaring and venting.
Waste
We aim to reduce the amount of waste we generate and to reuse or recycle materials, wherever possible. For example, in 2015, five of our Downstream manufacturing sites sent more than 75% of their waste generated during the year off-site for recycling or reuse. We track the amount of waste sent off-site for disposal or recycling.
