Trees reflect on bubble in mid air (photo)

Our performance

Each year, we assess the safety of our operations and our impact on the environment, including our greenhouse gas emissions. We also work closely with communities near our operations to address concerns and we contribute in areas such as local employment and education.

This section provides information on our safety, economic, environmental and social performance in 2016.

Head with helmet (icon)Head with helmet (icon)
1.00

Our total recordable case frequency of injuries and safety incidents per million working hours in 2016

Water drop (icon)Water drop (icon)
71

Our number of operational spills in 2016

Torso with heart (icon)Torso with heart (icon)
$102 million

Spent on voluntary social investment in 2016
Inside Our performance

Safety

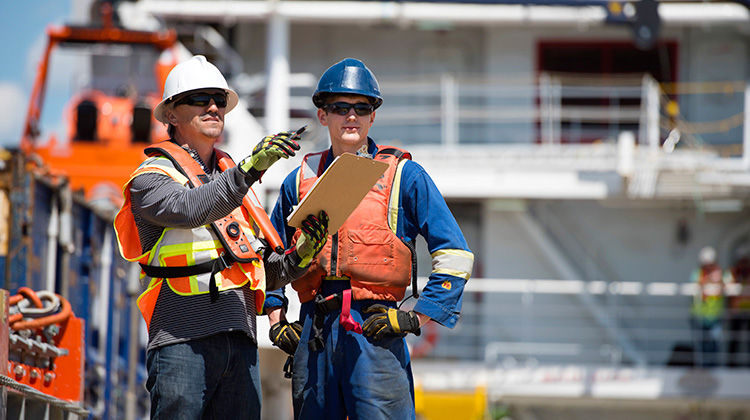
We worked relentlessly in 2016 to strengthen our safety culture and leadership.

Security

We carefully assess the security threats and risks to our operations.

Environment

We improved or maintained our environmental performance across most business areas in 2016.

Social performance

We aim to be good neighbours wherever we work, by contributing to the well-being of communities.

Embedding sustainability into projects

Environmental, social and health assessments help us understand and manage the impact of our projects.

Chart generators

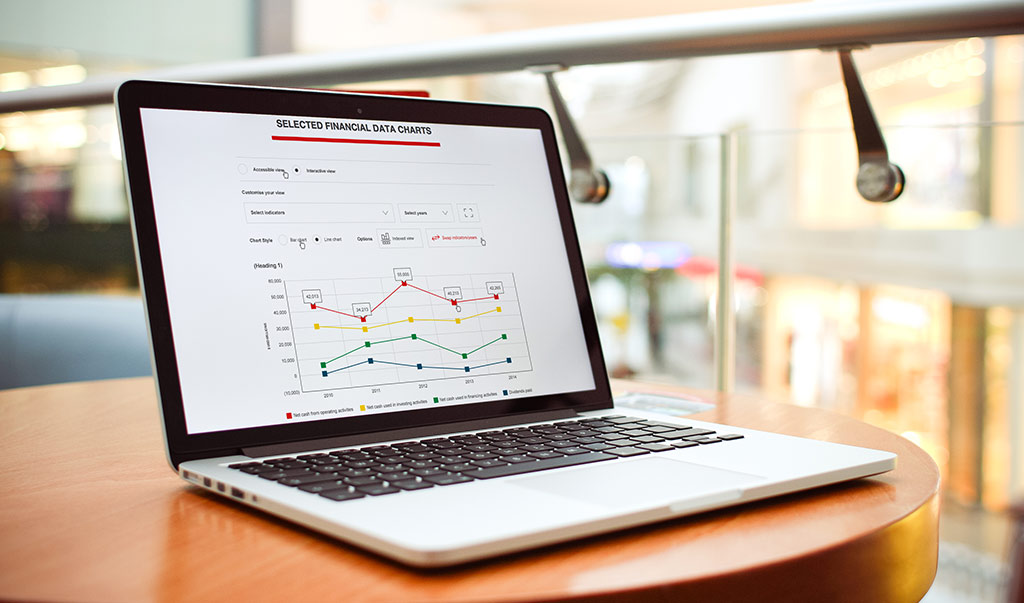
Build your own individual charts based on the ten-year overview tables for environmental data and social and safety data. Selectable key figures and time periods as well as the option to index the starting point make the data easily comparable.

View our interactive chart tool on environmental data View our interactive chart tool on social and safety data