


Other regulatory disclosures
GHG emissions and energy consumption data – information provided in accordance with UK regulations
Data in this section are consolidated using the operational control approach. Under this approach, we account for 100% of the GHG emissions and energy consumption in respect of activities where we are the operator, irrespective of our ownership percentage.
Reporting on this operational control basis differs from that applied for financial reporting purposes in the "Consolidated Financial Statements". We acknowledge the strong preference of the UK's Financial Reporting Council (FRC) for companies to report the GHG emissions and energy consumption data using the financial consolidation boundary and are working on including the data and information on this boundary in our Annual Report in the future.
|
2023 |
2022 |
2021 |
||||||||||
|---|---|---|---|---|---|---|---|---|---|---|---|---|---|
Total global direct (Scope 1) [A] |
50 |
51 |
60 |
||||||||||
UK including offshore area [B] |
1.7 |
1.7 |
1.7 |
||||||||||
Market-based |
|
|
|
||||||||||
Total global energy indirect (Scope 2) [C] |
7 |
7 |
8 |
||||||||||
UK including offshore area |
0 |
0 |
0 |
||||||||||
Location-based |
|
|
|
||||||||||
Total global energy indirect (Scope 2) [D] |
8 |
8 |
9 |
||||||||||
UK including offshore area |
0.04 |
0.04 |
0.05 |
||||||||||
Intensity ratio in tonnes per tonne |
|
|
|
||||||||||
Intensity ratio of all facilities [E] |
0.27 |
0.27 |
0.27 |
||||||||||
|
|||||||||||||
The activity data used to calculate GHG intensity ratios at a portfolio level shown in the table above are reported on an operational control basis. As a result, they are not directly comparable with the production data reported elsewhere in this Report, which are reported on a financial control basis. The table below shows the numbers used in the calculation of the intensity:
Energy use in our operations
The energy consumption data provided below comprise own energy, generated and consumed by our facilities, and supplied energy (electricity, steam and heat) purchased by our facilities for our use.
Energy consumption data reflect primary (thermal) energy (e.g. the energy content of fuels used to generate electricity, steam, heat, mechanical energy, etc.). This includes energy from renewable and non-renewable sources. Own energy generated was calculated by multiplying the volumes of fuels consumed for energy purposes by their respective lower heating values. Own energy generated that was exported to third-party assets or to the power grid is excluded. Thermal energy for purchased and consumed electricity was calculated using actual electricity purchased multiplied by country-specific electricity generation efficiency factors (from IEA statistics). Thermal energy for purchased and consumed steam and heat was calculated from actual steam/heat purchased multiplied by a supplier-specific conversion efficiency, or a generic efficiency factor where supplier-specific data were not available.
Our energy consumption decreased from 209 billion kilowatt-hours (kWh) in 2022 to 205 billion kWh in 2023, in line with the decrease in our Scope 1 and 2 GHG emissions. Around 1% of the energy we used in 2023 for our operations came from low-carbon and renewable sources.
|
2023 |
2022 |
2021 |
||
|---|---|---|---|---|---|
Own energy generated and consumed |
|
|
|
||
Total energy generated and consumed [A] |
174 |
177 |
205 |
||
UK including offshore area |
6.1 |
6.1 |
6.2 |
||
Purchased and consumed energy |
|
|
|
||
Total purchased and consumed energy [A] |
31 |
32 |
33 |
||
UK including offshore area |
0.2 |
0.2 |
0.2 |
||
Energy consumption |
|
|
|
||
Total energy consumed [A] |
205 |
209 |
238 |
||
UK including offshore area |
6.3 |
6.3 |
6.4 |
||
|
|||||
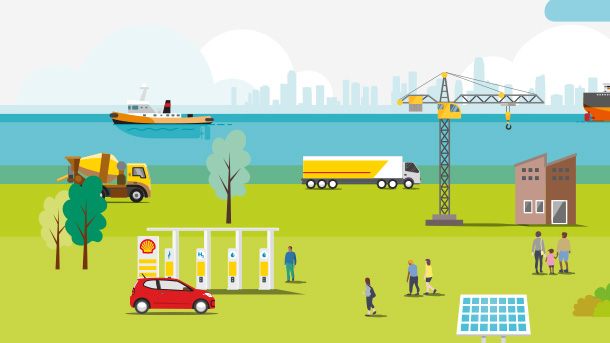
In 2023, we implemented a variety of measures to reduce the energy use and increase the energy efficiency of our operations.
Examples of some of the principal measures taken in 2023 to reduce energy use and improve efficiency (with estimated total savings of around 999 million kWh in 2023) are:
- At our Geismar site in the USA: idling the furnace when not required.
- At our Rheinland site in Germany: optimising the amount of steam required depending on use and load.
- At our Sarnia site in Canada: replacing an existing reaction furnace with a new high-intensity burner.
- At our Scotford complex in Canada: optimisation which enables a reduction in electricity and excess H2 vented to flare.
- At our Prelude site in Australia: optimisation of the process and operating conditions to reduce flaring.
- At our Pearl site in Qatar: reducing steam generation requirements via steam balance optimisation.
- At our GTL asset in Malaysia: optimising fuel flows to the boiler unit.
- At our UK Upstream operations: reducing compression power requirements between our Shearwater platform and St Fergus gas terminal.
- At our Gulf of Mexico operations in the USA: optimising power generation between platform and rig and upgrading existing equipment.
- At our Sarawak Shell Berhad assets in Malaysia: optimising the usage of Gas Turbine Generators from four to three units.
Examples of some of the principal measures that were taken in 2022 are listed below (with estimated total savings of around 1,155 million kWh in 2022):
- At our GTL asset in Qatar, we completed several projects to reduce energy use and improve efficiency, for example by making improvements to catalyst performance which resulted in reduced generation of off-gas leading to lower energy consumption.
- At our Gulf of Mexico operations in the USA, we implemented a project to reduce energy use and improve efficiency by using waste heat to generate steam.
- At our Upstream operations in the UK, we completed several projects to reduce energy use and improve efficiency, for example by implementing an online model to optimise fuel gas usage at Shearwater (our North Sea oil and gas operated asset).
- At our Scotford hydrocarbon processing site in Canada, we implemented several projects to reduce energy use and improve efficiency, for example by using analysers to optimise fuel usage.
- At our Geismar chemical plant in the USA, we implemented several projects to reduce energy use and improve efficiency, for example by improving how some equipment operates.
- At our QGC operations in Australia, we implemented several projects to reduce energy use and improve efficiency, for example by introducing a CO2/energy performance dashboard for control room operators, which allowed operators to identify potential efficiency savings based on real-time operating data.
EU Taxonomy Regulation
The EU Taxonomy Regulation is a classification system for determining when an economic activity can be considered environmentally sustainable according to European Union (EU) standards. It aims to encourage investment in a low-carbon economy by creating common definitions of sustainability and mandatory disclosures to help investors make informed decisions. As a UK company with its registered office and headquarters in London, Shell plc is not currently subject to the Taxonomy Regulation. Nevertheless, we elect to report against the taxonomy voluntarily because we recognise the importance of increasing transparency about how companies are progressing in the energy transition, even if the regulation is evolving. We expect to come into scope in 2024 via the EU's Corporate Sustainability Reporting Directive (CSRD), which extends the reporting obligations under the EU Taxonomy Regulation to third-country issuers that are listed on European exchanges.