Marketing
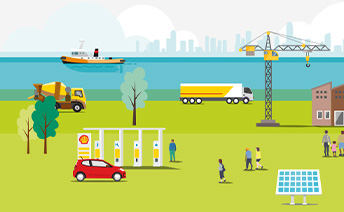
Marketing comprises Mobility, Lubricants, and Sectors and Decarbonisation activities. Mobility operates our retail network, including electric vehicle charging services. Lubricants produces, markets and sells lubricants for road transport, and for machinery used in manufacturing, mining, power generation, agriculture and construction. Through Sectors and Decarbonisation we provide services, fuels and other products that help customers reduce emissions in the aviation, marine and agricultural sectors, among others. We are high-grading our electric vehicle charging network to focus on key markets, such as China, Europe and the USA.
3.0 2022: 2.1
3.2 2022: 2.8
6.1 2022: 2.4
2,554 2022: 2,503
|
|
$ million, except where indicated |
|||||||
|---|---|---|---|---|---|---|---|---|---|
|
2023 |
2022 |
2021 |
||||||
Segment earnings* [A] [B] |
2,950 |
2,133 |
3,535 |
||||||
Identified items |
(229) |
(622) |
68 |
||||||
Adjusted Earnings* [A] |
3,180 |
2,754 |
3,468 |
||||||
Adjusted EBITDA* [A] |
6,037 |
5,324 |
6,021 |
||||||
Cash flow from operating activities |
6,088 |
2,376 |
5,019 |
||||||
Cash capital expenditure* |
5,612 |
4,831 |
2,273 |
||||||
Marketing sales volumes (thousand b/d) |
2,554 |
2,503 |
2,433 |
||||||
|
|||||||||
Business conditions
For the business conditions relevant to Marketing, see "Market overview".
Marketing sales
In 2023, Marketing sales volumes were 2% higher than in 2022, mainly as a result of improved demand from aviation.
Earnings 2023-2022
Segment earnings in 2023 were 38% higher than in 2022, reflecting higher Marketing margins (increase of $1,465 million), including higher unit margins in Mobility; higher margins in Lubricants because of lower feedstock costs; and higher volumes in Sectors and Decarbonisation. These increases were partly offset by higher operating expenses (increase of $703 million) and higher depreciation charges (increase of $264 million), mainly due to asset acquisitions.
Segment earnings in 2023 included impairment charges of $457 million and charges of $111 million related to redundancy and restructuring partly offset by gains of $298 million, related to indirect tax credits. These charges and gains are part of identified items and compare with 2022, which included net impairment charges and reversals of $321 million; net losses of $135 million related to the sale of assets; and provisions for onerous contracts of $62 million.
Adjusted Earnings increased by $426 million compared with 2022, as a result of the following:
- Mobility Adjusted Earnings were $53 million lower, mainly as a result of higher operating expenses and higher depreciation. This was partly offset by better margins.
- Lubricants Adjusted Earnings were $339 million higher, mainly because of higher margins due to lower feedstock costs.
- Sectors and Decarbonisation Adjusted Earnings were $141 million higher, mainly because of increased volumes and higher earnings in joint ventures.
Prior year earnings summary
Our earnings summary for the financial year ended December 31, 2022, compared with the financial year ended December 31, 2021, can be found in the Annual Report and Accounts (page 61) and Form 20-F (page 65) for the year ended December 31, 2022, as filed with the Registrar of Companies for England and Wales and the US Securities and Exchange Commission, respectively.
Cash flow from operating activities
Cash flow from operating activities was primarily driven by Adjusted EBITDA; working capital inflows of $873 million; and the timing impact of payments, relating to emission certificates and biofuel programmes of $296 million. These inflows were partly offset by tax payments of $744 million and non-cash cost-of-sales (CCS) adjustments of $221 million.
Cash capital expenditure
Cash capital expenditure in 2023 reflected $3.3 billion in low-carbon energy solutions, compared with $1.4 billion in 2022.
Cash capital expenditure in low-carbon energy solutions was 136% higher than in 2022, mainly due to the acquisition of Nature Energy and the expansion of our Mobility electric vehicle charging business.
See "Our journey to net zero".
Our cash capital expenditure is expected to be around $3 billion in 2024.
Portfolio and business developments
Significant portfolio and business development:
- In February 2023, we completed the acquisition of 100% of the shares of Nature Energy Biogas A/S for nearly $2 billion. This supports our ambitions to build an integrated renewable natural gas (RNG) value chain at global scale.
* Non-GAAP measure (see Non-GAAP measures reconciliations).


