Upstream overview


Conventional oil and gas
Cash engine


Deep water
Growth priority


Shales
Future opportunity
Milestones in 2016
- Following the acquisition of BG in February 2016, we completed the integration of BG assets into our portfolio.
- Also in early 2016, in the United Arab Emirates, we decided to exit the joint development of the Bab sour gas reservoirs (Shell interest 40%) with Abu Dhabi National Oil Company (ADNOC) in the emirate of Abu Dhabi, and to stop further work on the project.
- In Brazil, the seventh, eighth and ninth floating production, storage and offloading facilities (FPSO) – Cidade de Maricá, (Shell interest 25%, production capacity of 150 thousand boe/d), Cidade de Saquarema (Shell interest 25%, production capacity of 150 thousand boe/d) and Cidade de Caraguatauba (Shell interest 30%, production capacity of 100 thousand boe/d) respectively – achieved first oil in various offshore blocks.
- In Brunei, the non-Shell-operated ML South development (Shell interest 35%) achieved first production. The expected peak production from this development is around 40 thousand boe/d.
- In Kazakhstan, first crude oil was exported on October 29, 2016, and the Commencement of Commercial Production milestone was achieved on November 1, 2016, from the non-Shell-operated Kashagan development (Shell interest 16.8%).
- In Malaysia, we started production from the Malikai tension leg platform (TLP) (Shell interest 35%), located 100 kilometres off the coast of the state of Sabah. Malikai is expected to reach a peak production of 60 thousand boe/d.
- In the USA, we started production at the Stones development (Shell interest 100%) in the Gulf of Mexico. Stones is expected to produce around 50 thousand boe/d when fully ramped up at the end of 2017.
We continued to divest selected assets during 2016, including:
- In Canada, we sold our interest in 145 thousand net acres in the Deep Basin acreage and 61 thousand net acres in the Gundy acreage.
- In the USA, we sold our 100% interest in the Brutus TLP, the Glider subsea production system, and the oil and gas pipelines used to transport the production from the TLP.
- Also in the USA, we sold a 20% interest in the Kaikias development in the Gulf of Mexico. We retain an 80% interest.
- In Malaysia, we agreed to sell our 50% interest in the 2011 North Sabah EOR Production Sharing Contract in Malaysia, subject to obtaining regulatory and partner approval.
Additionally, in 2017
- In January, we agreed to sell our interests in some of our UK North Sea assets, for up to $3.8bn. The transaction is subject to partner and regulatory approvals, with completion expected in 2017.
- In March, we agreed to sell all of our in-situ and undeveloped oil sands interests in Canada, and reduce our interest in the Athabasca Oil Sands Project (AOSP), for a net consideration of $7.25 billion. Upon completion, we will continue as operator of the Scotford Upgrader and Quest carbon capture and storage (CCS) project. The transactions are expected to close in mid-2017, subject to customary closing conditions, adjustments and regulatory approvals.
|
Upstream key statistics | |||||||||
|---|---|---|---|---|---|---|---|---|---|
|
|
2016 |
2015 |
2014 |
2013 |
2012 | ||||
|
|||||||||
|
Earnings ($ million) |
(3,674) |
(8,833) |
5,231 |
3,640 |
11,254 |
||||
|
Earnings excluding identified items ($ million) |
(2,704) |
(2,255) |
6,754 |
6,644 |
10,693 |
||||
|
Cash flow from operating activities ($ million) |
7,662 |
5,453 |
19,150 |
17,841 |
22,131 |
||||
|
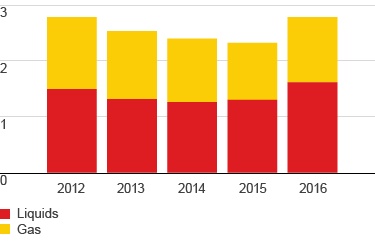
Liquids production (thousand b/d) [A] |
1,615 |
1,305 |
1,263 |
1,317 |
1,495 |
||||
|
Natural gas production (million scf/d) [A] |
6,781 |
5,911 |
6,593 |
7,059 |
7,488 |
||||
|
Total production (thousand boe/d) [A][B] |
2,784 |
2,323 |
2,399 |
2,534 |
2,786 |
||||
|
Capital investment ($ million) |
47,507 |
18,349 |
22,169 |
28,481 |
25,102 |
||||
|
Capital employed ($ million) |
128,782 |
84,727 |
88,692 |
93,135 |
87,413 |
||||
|
Employees (thousands) |
22 |
22 |
22 |
21 |
N/A |
||||
Upstream earnings and cash flow [A]
$ billion
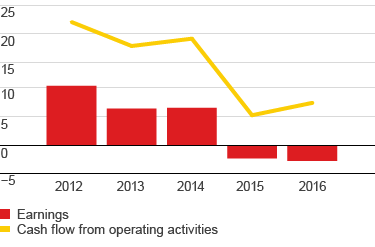

[A] Earnings excluding identified items.
Production available for sale
mboe/d