
Our approach
We have set a target to be net zero on greenhouse gas (GHG) emissions generated by all our operations by 2050, in step with society, as well as on emissions associated with the energy we need to power them.
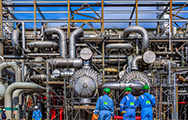
Improving the energy efficiency of our facilities is one of the ways to help us reduce GHG emissions from our operations. We achieve this by replacing old machinery with more energy-efficient equipment, among other things.
We will work to ensure that any GHG emissions from making our products that cannot be avoided will be captured or offset using technology and nature.
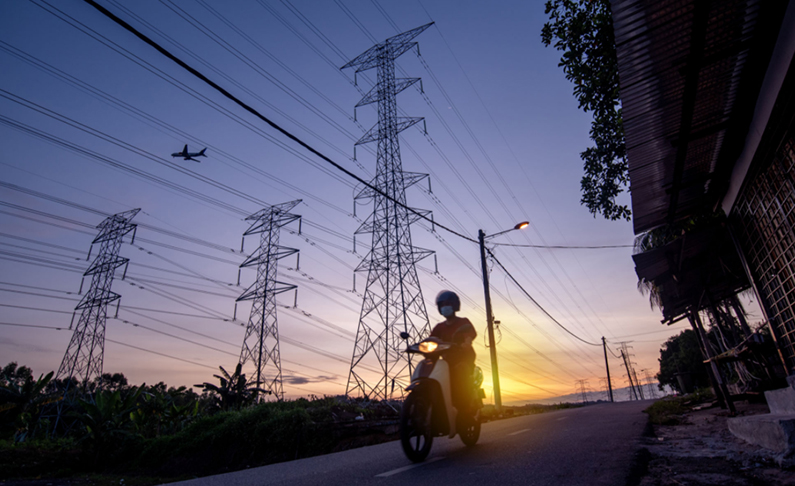
We aim to eliminate the GHG emissions that are generated from the electricity we buy to power our operations. We are taking a number of steps to achieve this, including buying renewable energy certificates and increasing our use of electricity from renewable sources (see Wind and Solar).

The Gangarri Solar Project in Australia will help power our QGC natural gas project in Queensland and has the potential to reduce QGC’s carbon dioxide emissions by around 300,000 tonnes a year.
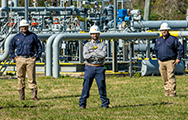
We require projects and facilities that produce more than 50,000 tonnes of GHG emissions a year to have a GHG emissions and energy management plan in place.
These plans encourage site managers to take steps such as using more energy-efficient equipment, installing power from renewable sources and evaluating readiness for carbon capture, utilisation and storage in the design of our new and largest projects, with the aim of reducing our emissions. Plans must include the sources of GHG emissions, as well as a forecast of expected emissions at the site for at least 10 years.
Projects under development that are expected to have a material emissions footprint must meet our carbon performance standards or industry benchmarks. During development, projects are expected to evaluate relevant low-carbon technologies and options to remove these emissions.
To assess the resilience of proposed projects, we consider factors such as potential costs associated with operational GHG emissions. We use short-, medium- and long-term estimates of future carbon costs that are specific to each country. These estimates are reviewed and updated on an annual basis. This is an important part of our efforts to stay in step with society’s progress toward the goals of the Paris Agreement.
The process for developing these estimates uses short-term policy outlooks and long-term scenario forecasts, both of which reflect the current nationally determined contributions (NDCs) submitted by countries as part of the Paris Agreement and evolving national policy developments. By 2050, our estimates for all countries increase to at least $100 a tonne of GHG emissions. The United Nations estimate that the current NDCs are consistent with limiting the rise in global average temperature to around three degrees Celsius above pre-industrial levels. They are the first NDCs under the Paris Agreement and are scheduled to be revised every five years. In the coming decades, we expect countries to tighten their NDCs to meet the goals of the Paris Agreement. We expect to update our estimates as countries update their NDCs and climate policies. Accordingly, we believe our estimates appropriately reflect society’s current implementation of the Paris Agreement.
Greenhouse gas emissions performance
Our direct GHG emissions decreased from 70 million tonnes of CO2 equivalent in 2019 to 63 million tonnes of CO2 equivalent in 2020.
Direct greenhouse gas emissions
million tonnes CO2e

Scope 1 and Scope 2 GHG emissions changes from 2019 to 2020
million tonnes CO2e

[A] Total greenhouse gas emissions are rounded to the closest million tonnes
[B] Does not include ~0.94 million tonnes of CO2 captured and sequestered by our Quest CCS project in Canada in 2020
The main reasons for this decrease were divestments (for example, in Canada and the USA) and the number of our facilities operating at reduced capacity due to lower demand driven by the COVID-19 pandemic. In addition, our Prelude floating liquefied natural gas installation in Australia did not run at full capacity in 2020.