Market overview
Shell realised prices |
Year average |
|||||||||
|---|---|---|---|---|---|---|---|---|---|---|
|
2016 |
2015 |
2014 |
2013 |
2012 |
|||||
|
SUBS |
JV&A |
SUBS |
JV&A |
SUBS |
JV&A |
SUBS |
JV&A |
SUBS |
JV&A |
Crude oil and natural gas liquids ($/b) |
|
|
|
|
|
|
|
|
|
|
Europe |
38.62 |
40.75 |
49.77 |
45.97 |
94.57 |
89.68 |
105.23 |
99.27 |
108.13 |
104.60 |
Asia |
38.11 |
43.95 |
47.73 |
52.21 |
89.47 |
96.85 |
96.46 |
70.34 |
107.76 |
67.33 |
Oceania |
36.64 |
33.76 |
43.39 |
50.01 |
82.26 |
88.07 |
90.50 |
91.91 |
91.62 |
90.14 |
Africa |
42.73 |
– |
51.80 |
– |
100.55 |
– |
110.14 |
– |
112.45 |
– |
North America – USA |
37.50 |
– |
44.99 |
– |
87.90 |
– |
98.10 |
– |
103.59 |
110.00 |
North America – Canada |
25.76 |
– |
25.45 |
– |
59.19 |
– |
63.14 |
– |
68.31 |
– |
South America |
38.58 |
– |
42.38 |
– |
88.68 |
– |
97.17 |
94.01 |
100.01 |
97.33 |
Total |
38.60 |
43.58 |
47.52 |
51.82 |
91.09 |
95.87 |
99.83 |
72.69 |
107.15 |
76.01 |
Natural gas ($/thousand scf) |
|
|
|
|
|
|
|
|
|
|
Europe |
4.75 |
4.19 |
7.10 |
6.46 |
8.58 |
8.26 |
10.29 |
9.17 |
9.48 |
9.64 |
Asia |
2.32 |
4.63 |
3.02 |
7.06 |
4.57 |
11.50 |
4.51 |
10.73 |
4.81 |
10.13 |
Oceania |
5.31 |
4.33 |
6.80 |
6.73 |
10.49 |
11.01 |
11.55 |
9.45 |
11.14 |
9.48 |
Africa |
2.33 |
– |
2.10 |
– |
2.71 |
– |
2.84 |
– |
2.74 |
– |
North America – USA |
2.21 |
– |
2.39 |
– |
4.52 |
– |
3.92 |
– |
3.17 |
7.88 |
North America – Canada |
1.71 |
– |
2.29 |
– |
4.39 |
– |
3.26 |
– |
2.36 |
– |
South America |
1.83 |
– |
2.46 |
– |
2.85 |
– |
2.91 |
0.42 |
2.63 |
1.04 |
Total |
3.16 |
4.41 |
4.07 |
6.77 |
5.68 |
9.72 |
5.85 |
9.72 |
5.53 |
9.81 |
Other ($/b) |
|
|
|
|
|
|
|
|
|
|
North America – Synthetic crude oil |
37.61 |
– |
40.87 |
– |
81.83 |
– |
87.24 |
– |
81.46 |
– |
North America – Bitumen |
25.74 |
– |
30.25 |
– |
70.19 |
– |
67.40 |
– |
68.97 |
– |
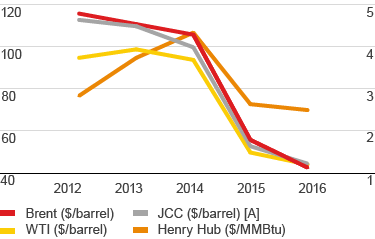
Oil and gas marker industry prices
$/barrel
$/MMBtu

[A] Japan Customs-cleared Crude is based on available market information at the end of the year.
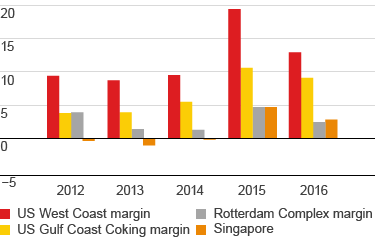
Industry refining margins [A]
$/barrel

[A] Refining industry margins do not represent the actual Shell realised margins for the periods.
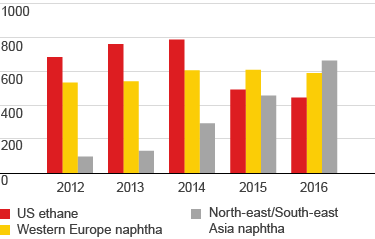
Industry chemicals margins
$/tonne

