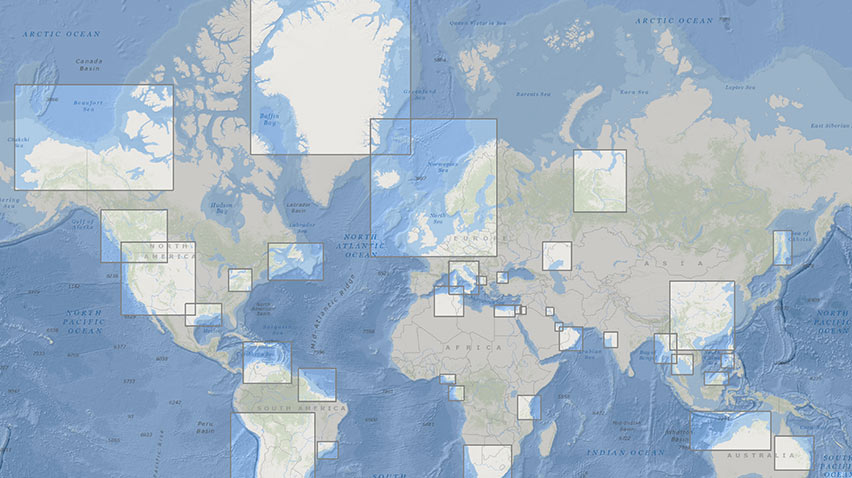
Proved oil and gas reserves
The tables present oil and gas reserves on a net basis, which means that they include the reserves relating to: (i) the Shell subsidiaries including the reserves attributable to non-controlling interest holders in our subsidiaries; and (ii) the Shell share of joint ventures and associates.
Proved crude oil and natural gas liquids, synthetic crude oil and bitumen reserves for Shell subsidiaries and the Shell share of joint ventures and associates [A] (at December 31) |
Million barrels |
||||||
|---|---|---|---|---|---|---|---|
|
2016 |
2015 |
2014 |
2013 |
2012 |
||
|
|||||||
Europe |
442 |
428 |
608 |
798 |
793 |
||
Asia |
1,642 |
1,576 |
1,682 |
1,724 |
1,706 |
||
Oceania |
128 |
138 |
140 |
163 |
174 |
||
Africa |
529 |
579 |
691 |
651 |
688 |
||
North America – USA |
491 |
560 |
711 |
991 |
903 |
||
North America – Canada |
|
|
|
|
|
||
Oil and NGL |
18 |
22 |
44 |
29 |
33 |
||
Synthetic crude oil |
2,014 |
1,941 |
1,763 |
1,731 |
1,763 |
||
Bitumen |
2 |
3 |
428 |
422 |
49 |
||
South America |
992 |
56 |
63 |
112 |
87 |
||
Total including year-average price effects |
6,258 |
5,303 |
6,130 |
6,621 |
6,196 |
||
Proved natural gas reserves for Shell subsidiaries and the Shell share of joint ventures and associates [A][B] (at December 31) |
Thousand |
||||||||
|---|---|---|---|---|---|---|---|---|---|
|
2016 |
2015 |
2014 |
2013 |
2012 |
||||
|
|||||||||
Europe |
10,238 |
11,386 |
12,296 |
13,275 |
14,168 |
||||
Asia |
15,827 |
16,055 |
16,101 |
16,161 |
16,311 |
||||
Oceania |
9,082 |
5,946 |
6,078 |
7,001 |
6,610 |
||||
Africa |
2,225 |
2,236 |
2,621 |
2,257 |
2,241 |
||||
North America – USA |
675 |
754 |
1,561 |
2,199 |
2,352 |
||||
North America – Canada |
844 |
955 |
1,611 |
1,500 |
1,011 |
||||
South America |
1,650 |
43 |
48 |
80 |
99 |
||||
Total including year-average price effects |
40,541 |
37,375 |
40,316 |
42,473 |
42,792 |
||||
Total proved oil and gas reserves [A][B] (at December 31) |
Million boe |
||||||||
|---|---|---|---|---|---|---|---|---|---|
|
2016 |
2015 |
2014 |
2013 |
2012 |
||||
|
|||||||||
Europe |
2,207 |
2,391 |
2,728 |
3,087 |
3,236 |
||||
Asia |
4,371 |
4,344 |
4,458 |
4,510 |
4,518 |
||||
Oceania |
1,694 |
1,163 |
1,188 |
1,370 |
1,314 |
||||
Africa |
913 |
965 |
1,143 |
1,040 |
1,074 |
||||
North America – USA |
607 |
690 |
980 |
1,370 |
1,309 |
||||
North America – Canada |
2,180 |
2,131 |
2,513 |
2,441 |
2,019 |
||||
South America |
1,276 |
63 |
71 |
126 |
104 |
||||
Total including year-average price effects |
13,248 |
11,747 |
13,081 |
13,944 |
13,574 |
||||
Year-average price effects |
(1,480) |
(1,707) |
44 |
48 |
(431) |
||||
