Overall highlights in 2015
Financial resilience
CCS earnings
$10.7 billion
excluding identified items. $1.9 billion income attributable to shareholders. [A]
Cash flow from operating activities
$29.8 billion
Operating costs
$4.1 billion lower
in 2015 at $41.1 billion, compared to 2014
Gearing
14.0%
remained low despite the economic downturn
Total dividends distributed
$12.0 billion
of which $2.6 billion were settled by issuing around 96.3 million A shares under the Scrip Dividend Programme
Capital investment
22.7% lower
in 2015 at $28.9 billion, compared to 2014
- [A]
- See consolidated statement of income.
BG Group
In April 2015, the Boards of Shell and BG Group plc (BG) announced that they had reached agreement on the terms of a recommended cash and share offer to be made by Shell for BG. In January 2016, shareholders of both Shell and BG voted in favour of the transaction, which was completed on February 15, 2016.
Discoveries
We made six notable discovery and appraisal successes, along with 13 near-field discoveries close to our existing Upstream assets.
Portfolio
We took four major final investment decisions (FID) to:
- advance the Appomattox deep-water development (Shell interest 79%) in the Gulf of Mexico, USA;
- debottleneck the Scotford refinery;
- construct a fourth alpha olefins unit at our chemical manufacturing site in Geismar, Louisiana USA; and
- build a solvent deasphalter unit at the Pernis refinery, the Netherlands.
Our divestments in 2015 totalled $5.5 billion. We continue to simplify our portfolio, as demonstrated by our decisions to:
- cease further exploration activity offshore Alaska for the foreseeable future;
- not continue construction of the 80 thousand barrels of oil equivalent per day (kboe/d) Carmon Creek thermal in-situ project (Shell interest 100%);
- sell 125,261,200 shares in Showa Shell Sekiyu KK, representing a 33.24% shareholding in the company; and
- sell OMLs 18 and 29 and related facilities in the Eastern Niger Delta, and the Nembe Creek Trunk Line.
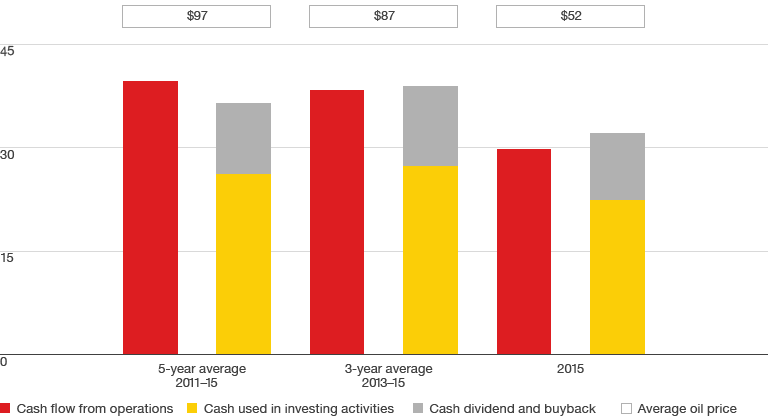
Cash flow management and track record
$ billion