Results
Summary of results |
$ million unless specified |
||||||
|---|---|---|---|---|---|---|---|
|
2015 |
2014 |
2013 |
2012 |
2011 |
||
|
|||||||
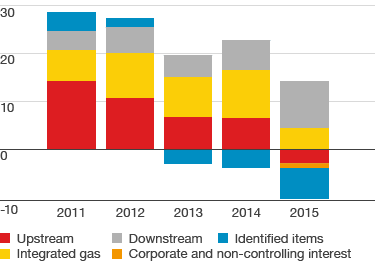
Integrated Gas |
3,170 |
10,610 |
8,998 |
10,990 |
7,280 |
||
Upstream |
(8,833) |
5,231 |
3,640 |
11,254 |
17,186 |
||
Downstream (CCS basis) |
10,243 |
3,411 |
3,869 |
5,382 |
4,170 |
||
Corporate and non-controlling interest |
(738) |
(211) |
238 |
(462) |
(103) |
||
CCS earnings attributable to shareholders |
3,842 |
19,041 |
16,745 |
27,164 |
28,533 |
||
CCS adjustment for Downstream [A] |
(1,903) |
(4,167) |
(374) |
(452) |
2,293 |
||
Income attributable to Royal Dutch Shell plc shareholders |
1,939 |
14,874 |
16,371 |
26,712 |
30,826 |
||
Identified items [A] |
(7,604) |
(4,010) |
(3,273) |
1,905 |
3,938 |
||
CCS earnings attributable to shareholders excluding identified items |
11,446 |
23,051 |
20,018 |
25,259 |
24,595 |
||
Basic CCS earnings per share ($) |
0.61 |
3.02 |
2.66 |
4.34 |
4.60 |
||
CCS adjustment per share |
(0.30) |
(0.66) |
(0.06) |
(0.07) |
0.37 |
||
Basic earnings per share ($) |
0.31 |
2.36 |
2.60 |
4.27 |
4.97 |
||
Basic earnings per ADS ($) |
0.62 |
4.72 |
5.20 |
8.54 |
9.94 |
||
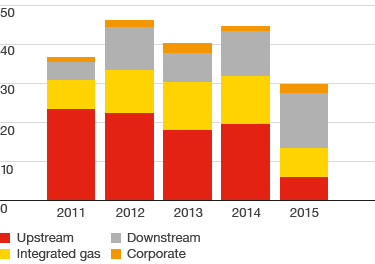
Net cash from operating activities |
29,810 |
45,044 |
40,440 |
46,140 |
36,771 |
||
Cash flow from operating activities per share ($) |
4.72 |
7.14 |
6.43 |
7.37 |
5.92 |
||
Dividend per share ($) |
1.88 |
1.88 |
1.80 |
1.72 |
1.68 |
||
Dividend per ADS ($) |
3.76 |
3.76 |
3.60 |
3.44 |
3.36 |
||
CCS earnings
$ billion

Net cash from operating activities
$ billion

ROACE – underlying 2015 [A]
%
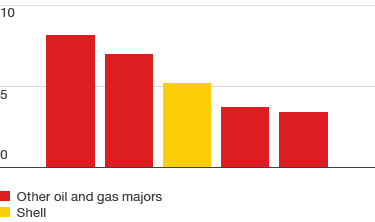

[A] European companies: CCS basis excluding identified items.
US companies: reported earnings excluding special non-operating items.
TSR growth 2014–Q1 2016 [A]
%
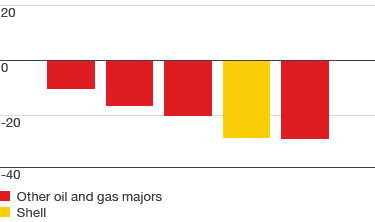

[A] Total shareholder return is averaged across year-end.