Conventional oil & gas


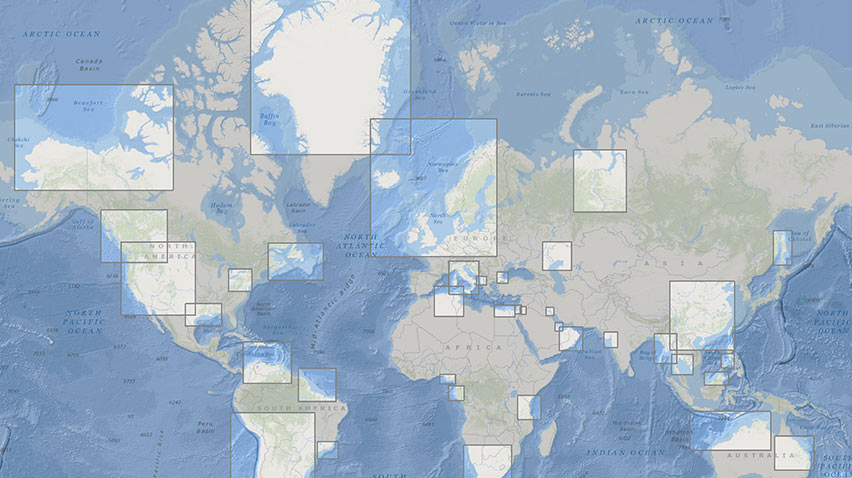
The conventional oil and gas business is a cash engine for Shell. There is a large range of assets here, ranging from the more traditional basins such as in the North Sea, Nigeria, Malaysia, Oman and Brunei, as well as more recent positions such as in Iraq and Kazakhstan. Our growth projects in conventional oil and gas should add some 250 thousand barrels per day (b/d) of production in the next few years. This, combined with lower spend and improved uptime, should improve our performance in free cash flow and returns.
Our conventional oil and gas operations are important to most of the countries in which we operate. We have always worked with a high level of government involvement and regulatory control and we partner with others to execute operations and share risk. We have a proven capability to sustain deep relationships, spanning many decades, with governments, national oil companies, other international oil companies (IOCs) and independents.
In Oman and Brunei, for example, we helped build their oil and gas businesses which have created a foundation for broader development that remains a principle source of revenue. In the UK, Norway, the Netherlands and Denmark, we partnered with other IOCs and led the oil and gas industries, which helped boost these economies.
Following on from the acquisition of BG, we expect to accelerate the divestment of non-strategic positions in conventional oil & gas, to further strengthen this portfolio.
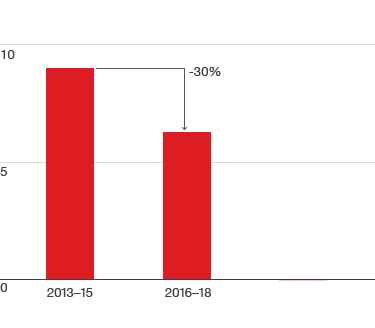
Selective growth
Thousand barrels per day
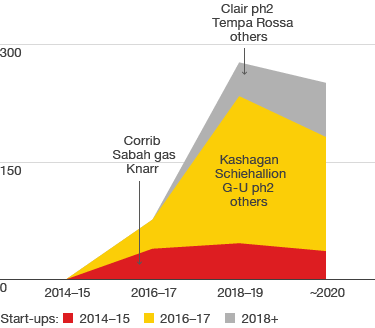

Capital investment
$ billion